
.jpg)
This study on Facebook videos has been refreshed in October 2017 for you to keep you updated about the latest developments in the usage of videos on Facebook.
Thousand of videos are shared on Facebook timelines everyday. So every time you view your Facebook timeline, you will probably come across some moving images. In particular, media companies and brands are making more and more use of videos. The strategy behind this is mainly the fact that video content has the advantage of engaging users for a longer period. Through the combination of visual and audio components, videos have the possibility to transmit an experience that goes beyond that of images. A previous study dated back to December 2016 revealed that 90% of videos published on Facebook were Facebook native videos, which has since then increased to 92%. The aim of this blog post is to look into the changes that occurred and to also check if a trend in the different video types used on Facebook is detectable. The focus of this study lies not solely on the different video formats such as Facebook native videos, YouTube videos, Vimeo videos and other video formats (e.g. video players created by companies), but also how users implement them into their strategy, and to provide information about engagements with these videos.

The study tackles the most important questions like: What video format is most used by brands, and which video format brings the most interactions? These findings not only try to answer these questions but also want to provide valuable insights for marketers in order to boost their reach and interactions on Facebook. Note: 187,000 pages were analyzed in total and over 7.5 million posts were screened in the period from January 2017 to July 2017. This study also only considers video performance on Facebook and does not evaluate how that same content might be performing on any of the other third party platforms.
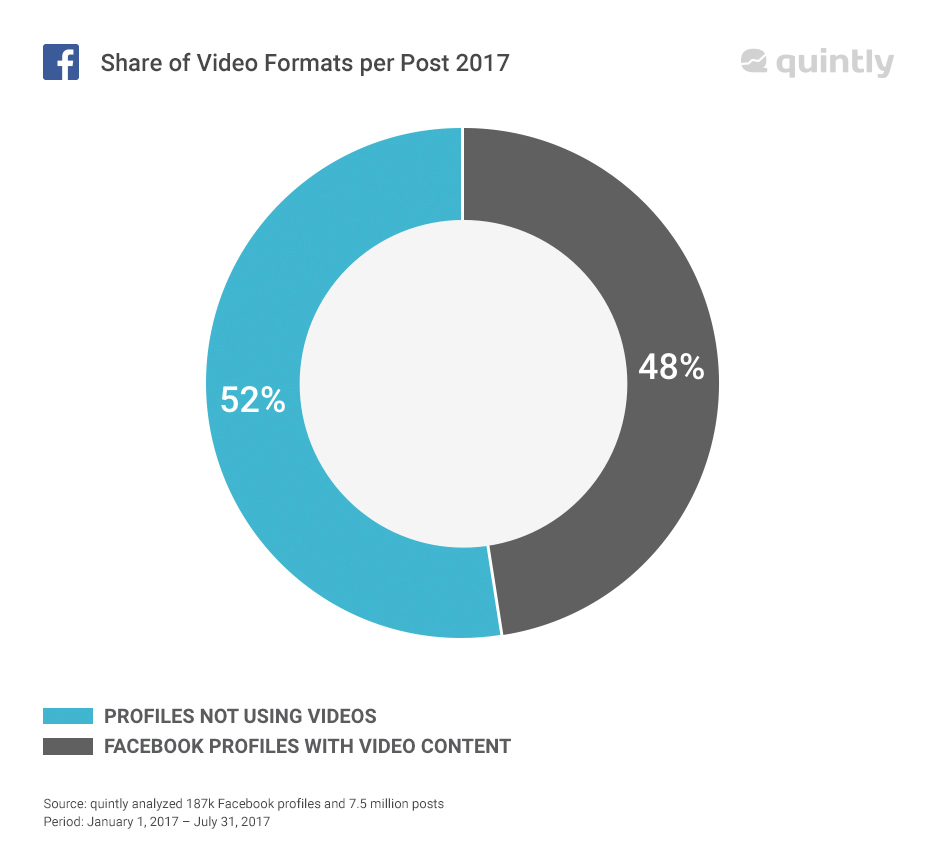
48% of Facebook pages uploaded a video
Videos on Facebook are on the rise: Nearly every second Facebook profile (48%) uploaded a video to their timeline. By taking a look at the exact numbers on the page level, it was seen that 92% of the pages that posted a video used at least one Facebook native video - Facebook Live videos are included in this - to their timeline. A rise of 2% from our last study. From this, we can gather that this video format is the preferred format among the analyzed pages.
The share of pages that used YouTube videos has declined by 4% points from the previous 30% to 26%, which is three times less than the use of Facebook native videos. A look at the number for the Vimeo format shows that this type nearly vanished from the Facebook timelines. Only 1% - in the previous study Vimeo’s share was 2% - of the pages included a video of this type. The share of pages that used another video format had an overall share of 6%.
Usage of YouTube & Vimeo on Facebook is declining
Digging deeper into the video posts itself, we can reveal more on the share of posts per video type. By breaking down the use of the different formats in the posts, it was evident that 89% of the overall video posts were Facebook native videos. In our last study the share was 84% - That is equivalent to 6,712,181 video posts - an overwhelming number that underlines the dominance of Facebook native videos. The rise of this video usage is not really surprising, especially when you think of how your own Facebook timeline looks. It is visible in nearly every timeline. The second place in terms of video posts are YouTube videos with a share of around 8% - that is decrease of about 3% since we last took a look at the numbers. Now only 574,240 videos posted on Facebook where YouTube videos! That means the usage of YouTube videos is declining.
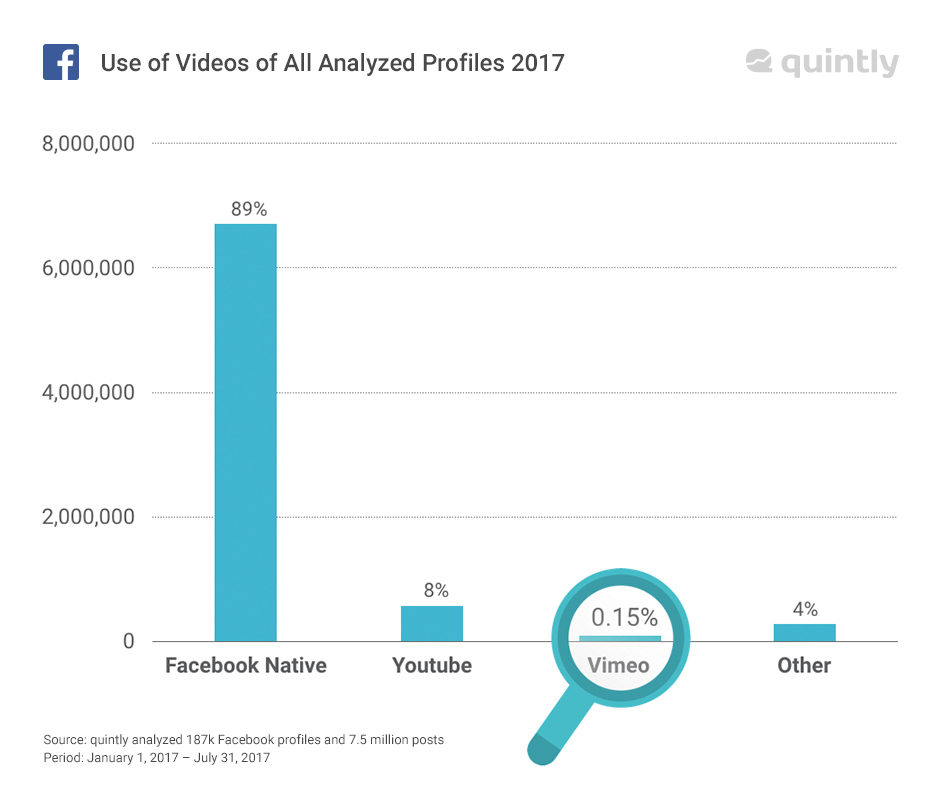
It seems that other video formats only play a marginal role on Facebook, because they only held a share of about 4% (278,690 videos). Vimeo had the least amount of shares with 11,549 posts, that equals a share of 0.15%.
While analyzing your Facebook performance you always need to keep in mind what your goals are and optimize towards this. If the goal would be increasing your Facebook Reach, Facebook Native videos will outperform videos posted on YouTube.
Up to 8x times more comments on Facebook native videos
After covering the share of profiles that integrate different video formats on their timeline it is now time to look into the interactions of the video posts. To provide a clear and comprehensive overview of this matter, this portion only analyzes the interactions of Facebook native videos and YouTube videos. Performance is always an interesting topic for marketers, as it provides valuable information on the post’s success and what may need to be modified for future videos. Note: Performance is the total number of reactions, comments and shares a post receives. The interactions for Facebook native videos were on average 168% higher than for YouTube videos. Looking at these figures, it’s already apparent that Facebook native videos consistently receive higher interactions. With that said, the number has risen even higher to 304% interactions for Facebook native videos in July 2017.
The study also looked at the amount of shares that Facebook native and YouTube videos received. To quickly summarize, Facebook native videos had on average a 477% higher share rate compared to YouTube videos. The number of shares peaked in July 2017 to over 611%. This underlines once again the dominance of Facebook native videos over the YouTube format. Another interesting insight we can provide about the interactions on videos on Facebook are relating to the user comments. The most interesting figure here is the average number of comments on each video type. Once again it can be seen that Facebook native videos encourage more users to interact with the content. Compared to YouTube videos, Facebook native video received on average 530% more comments. That means that Facebook’s own video type encourages five times more people to comment on their videos. Interestingly this number even went up to 806% in May 2017.
Our Facebook video study takeaways
Let’s quickly summarize our findings. A crucial takeaway from this study is that Facebook native videos are the dominant video format on Facebook. Therefore, it is not really surprising that the numbers not only show that is the favorite type of video format across all pages, but also that using this format can be beneficial to increasing the amount of shares and overall interactions. A reasonable explanation of that could be that Facebook favors their own video formats, but this could be one reasonable explanation for the strong numbers of Facebook native videos.
Considering what we found, it would be highly recommended to only use videos that you directly uploaded on Facebook as other formats generally receive much lower engagement than Facebook native videos. So if you still use the convenient option to simply share your YouTube videos, this might hurt the overall performance of your social media marketing. However, please remember that this is not an overall assessment of various video platforms, but only of how these formats perform on Facebook.
Now we’d like to hear from you: What is your favorite video type on Facebook? Just leave us a comment or send a tweet.
UPDATE: Agorapulse put this study to the test and could confirm our results. They also checked the effects on reach. You can find their experiment here.

Join the conversation. Leave us a comment below!