Facebook Reach is essential for every marketer. Many strategies work towards increasing it. The cornerstone of being successful on Facebook, including a high reach, is measuring it appropriately. You can analyze Facebook Reach to either find potential area of improvements for the content of your page or to increase and analyze your audience. However if you want to have a comprehensive view on how your page or posts perform, you should also analyze how often users engage with your content. The following post will explain how to analyze Facebook Reach in detail with focus on content optimization and how to include it into your Facebook analytics.
As Facebook Reach is a private metric, Facebook Reach always requires Insights permissions for the pages you want to analyze. In our latest Facebook Post Reach Explained article, we gave a detailed overview of the different characteristics and types of Facebook reach. This article focuses on explaining how to use the numbers to optimize your page’s performance.
How to analyze Facebook Reach
Step 1: Discover characteristics of a successful post
Step 2: Determine virality of posts
Step 3: Identify posts with highest reach
Step 4: Check highest reach by time
Now that you know "what to do", dig deeper in the "how to do". In the following we will discuss the explained steps in more detail and showcase some examples for an easy understanding.
Step 1: Discover Characteristics of Posts Which Lead to Higher Reach
Facebook offers the number of reached users for every Facebook post of your page. You can compare the reach of your posts to spot characteristics and patterns within the posts which led to a high/low reach. You might, for example, see that posts which include questions have a higher reach than posts which don’t have questions in it. However, to really discover what factors impact your posts' reach, you'll have to do a bit of trial and error in the process.
Step 2: Determine the Virality of Posts
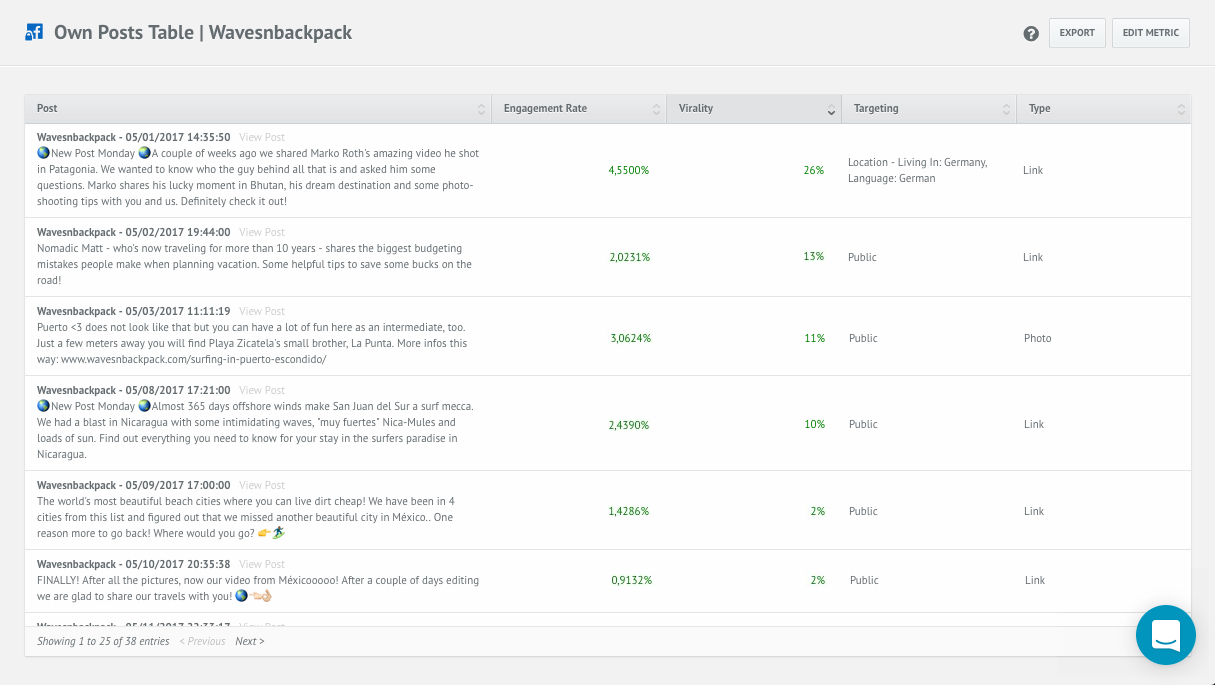
Viral Post Reach is equal to the number of people who saw your Facebook post from a story published by a friend. This means if a friend of yours likes, comments on or shares a post, you might see it as a story in your own news feed. The viral reach gives you an impression of how much the post was distributed by other Facebook users. You can look at the virality, i.e. the share of viral reach compared to the total reach of posts, and try to find what characteristics seem to lead to higher virality. Usually viral reach is more valuable than paid or organic reach because if users see that friends interacted with your page's content, it is like a confident recommendation - psychologists would speak of social proof. The impact, of course, depends on if the interaction is positive or negative. But as most of the interactions on Facebook come from the like reaction, it’s more likely that it will be positive. Check out this example of a small travel blog:
Step 3: Identify Post Types with Highest Reach
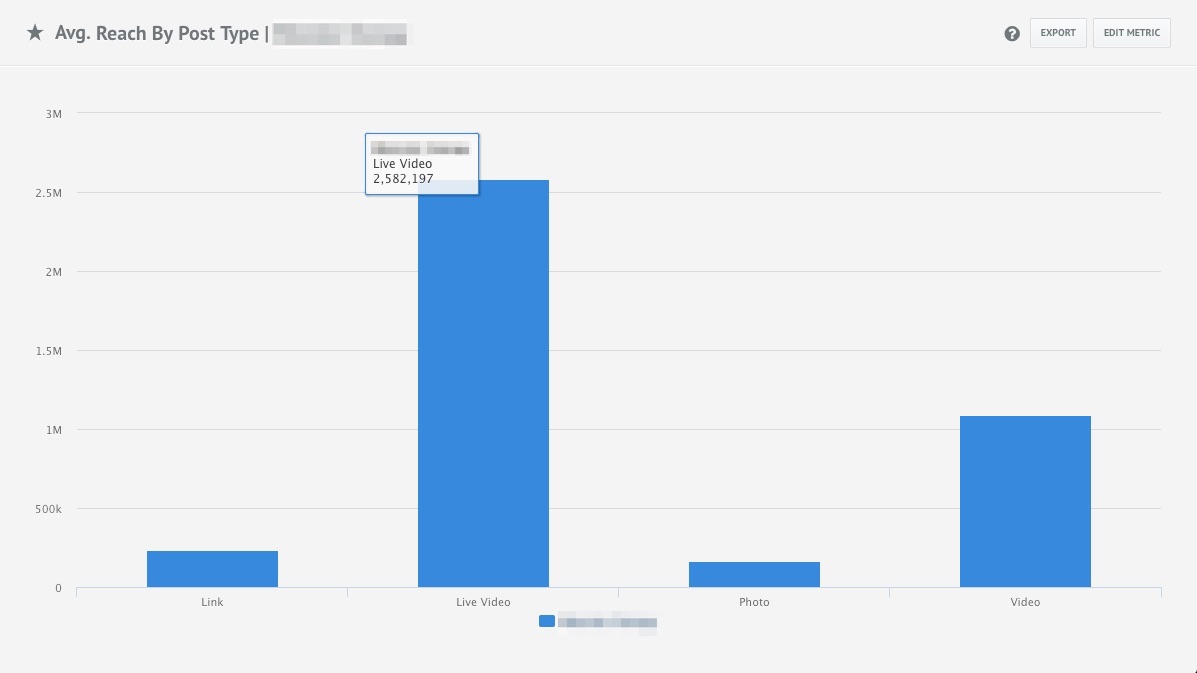
The screenshot below shows the average reach per post type. It quickly lets you identify which post types reached the most users on average. If you see that live videos have a higher reach than other post types, it might be a good idea to adjust your content plan and add more live videos to it. Of course, this is only based on the reach and doesn’t tell you anything about the quality of the reached users, so there may be other post types which get more interactions. But in terms of brand awareness, a high reach is very important and it makes sense to focus on post types with greater reach. However, it’s also important to still try out other post types as well in order to gather data about their different reaches and if they change over time.
Step 4: Pinpoint Posts with Highest Reach by Time
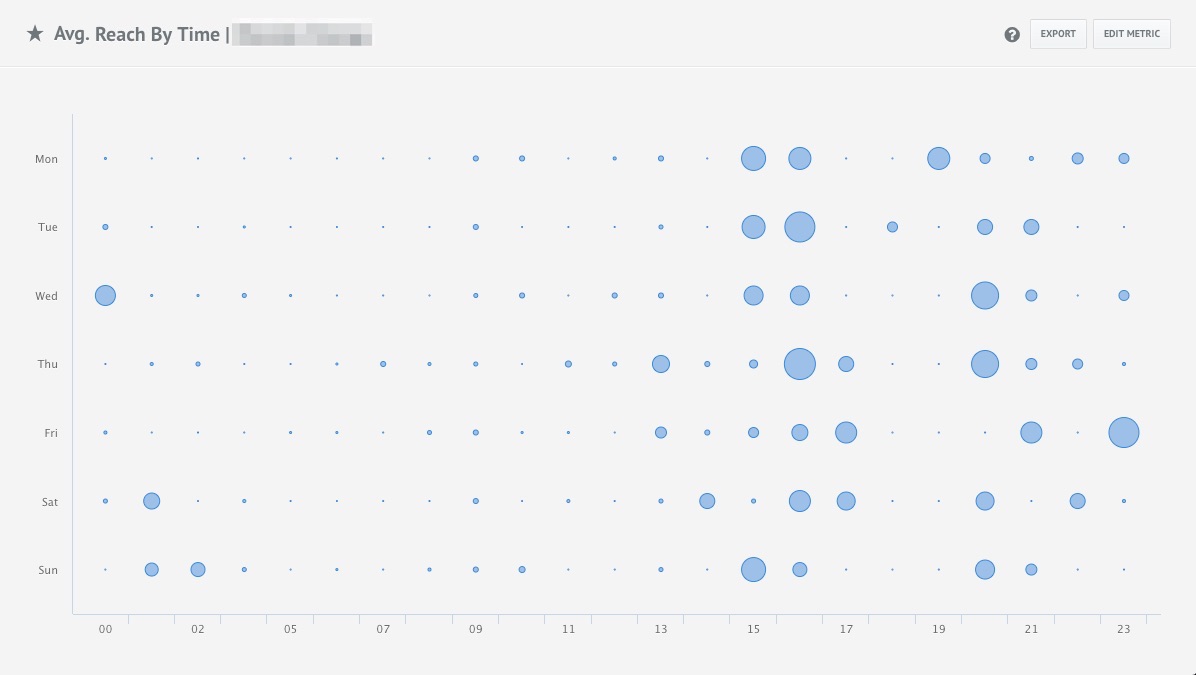
Besides finding the right post type, it’s also important to know when to post to get the highest reach. The screenshot below shows the average number of reached people per post, displayed by hour of the day and day of the week. To be more precise, it takes all posts which were created in a certain timeframe and shows the reach of them based on their create time, rather than based on the time the people were reached by the posts. If there was more than one post published on a certain weekday and hour, it will show the average reach of them. Taking a look at the chart, you can quickly spot the create times of posts that resulted in high reach and which didn’t. This can help you find better posting times. However similar to the “Avg. Reach By Post Type” chart, it’s also recommended to have a look at the Interaction Rate by Post Type to see what engagements posts earned.
Takeaways for marketers
Analyzing Facebook Reach is the cornerstone of successful Facebook marketing. As a marketer, you need to backup your decision-making process with data. Facebook Reach and the shown metrics can give you a great understanding on which content works best. With this knowledge, you are able to improve upcoming posts in order to reach more people with the content created. The presented four ways should be part of your Facebook analytics process to improve the efficiency and the ROI of social on the long run.

Join the conversation. Leave us a comment below!