Post updated in March 2022
You want your Facebook campaigns to generate brand awareness, leads, and sales. So, you need to reach as many people as possible with your content.
Once you start tracking your reach, you’ll understand whether you’re getting a healthy amount of likes, comments, and shares in relation to how many people see your content. In addition, increasing your Facebook reach can boost your engagement.
Though you know that reach is important, making sense of it can be complicated, as there are so many ways to measure and track reach.
Read on to learn all about Facebook reach—what it is, how to track it, and ways to increase it.
Find out how Facelift Data Studio can help you dive deep into Facebook analytics and measure the impact of your Facebook marketing using rich data insights.
What does reach mean on Facebook?
On Facebook, reach is the number of unique users who see your content, whether it’s displayed in their news feed, on your page, as a story, or in an ad.
You may have heard Facebook reach described as post reach or page reach. Post reach is the reach of a specific piece of content, whereas page reach is the number of people who view the page as a whole.
We can break Facebook reach down into a further three categories: organic, paid, and viral reach.
Facebook organic reach

Unfortunately, not all of your followers will see everything you post. Facebook’s algorithm presents a customized news feed for every user, based on that person’s past actions and interests.
When your content naturally shows up in a follower’s news feed, this counts as organic reach.
Facebook paid reach

To measure the success of your ad campaigns, you’ll have to look at your paid reach.
When you pay for a sponsored post, the post will appear in the timelines of people who don’t follow you.
Every person who sees your sponsored content is included in paid reach.
Facebook viral reach
You’ve probably noticed that sometimes posts appear in your Facebook timeline from pages that you don’t follow. Above the post, it says that one of your friends liked or commented on it.
When someone sees your content because a friend has engaged with it, that’s known as viral reach.
How is Facebook reach calculated?
Reach is the number of times your post is displayed on a unique screen. You can view this information for your page or any specific post in Facebook Insights, or in your social media analytics tool.
To calculate your average page reach, divide the average number of users reached per post (you can find this number in Facebook Insights) by the number of total page likes.
Facebook counts reach in daily, weekly, and 28-day intervals and this can sometimes cause some confusion.
For example, if someone sees your post today, that will count towards your daily reach. If they see the post again tomorrow, it will count again as daily reach. But, because reach only includes unique views, it will only count once in your weekly and 28-day reach.
Facebook reach vs impressions
Impressions are the total number of times your content displays on a screen.
If the same person views your content 10 times in one day, that will count as 10 impressions. However, it’ll only count once towards your daily reach.
So if a post shows up in a news feed from the original publisher and appears again when a friend shares it, this will count as two impressions but only one reach.
Facebook reach vs engagement
Engagement is when people interact with your post after they’ve seen it in their news feed. Likes, reactions, comments, and shares are all forms of engagement.
When people engage with your post, it can increase your reach because each interaction provides viral reach, where friends of followers will see your post.
Plus, Facebook’s algorithm favors engaging content, so it’s likely to boost it in people’s news feeds.
How to track Facebook reach with an analytics tool
You can monitor your reach in Facebook’s native analytics tool, Facebook Insights.
But a more effective way to track Facebook reach is with an analytics tool like Facelift Data Studio. You can slice up the data in many different ways, and compile all your findings in an easy-to-use dashboard. Plus, you can compare your Facebook performance to other social media channels, do competitive research, and generate easy-to-share reports.
Let’s have a look at some of the ways to track your Facebook reach with Facelift Data Studio, using the home decor brand North Home as an example.
Reach
The Reach metric shows you the number of unique users who have seen any content from your page over time.
It includes all your organic, viral, and paid reach combined.
For an overview of your daily, weekly, and 28-day reach, you can use the Page Post Reach Table.
Reach by Post Type
It’s useful to see which kinds of content are getting the most reach, as this could help you decide what to create more of.
In this case, albums are the post type with the highest reach, followed by photos. Videos seem to get the lowest reach—this is unusual because people are twice as likely to share video content than any other type of content.
Reach By Demographic
You probably know who your ideal customer is. But do you know whether your content is reaching the right demographic?
In the Reach by Age and Gender table, you can see whether your posts are reaching more men or women. In the above graph, there’s a roughly equal split between males and females in the 18-24 age group.
However, in other age ranges, more male users see North Home’s content than females.
You also need to consider the location of your followers. To find out which country your posts are reaching most people in, you can use the reach by country metric.
It’s no surprise that British brand North Home’s content is mostly reaching people in the UK.
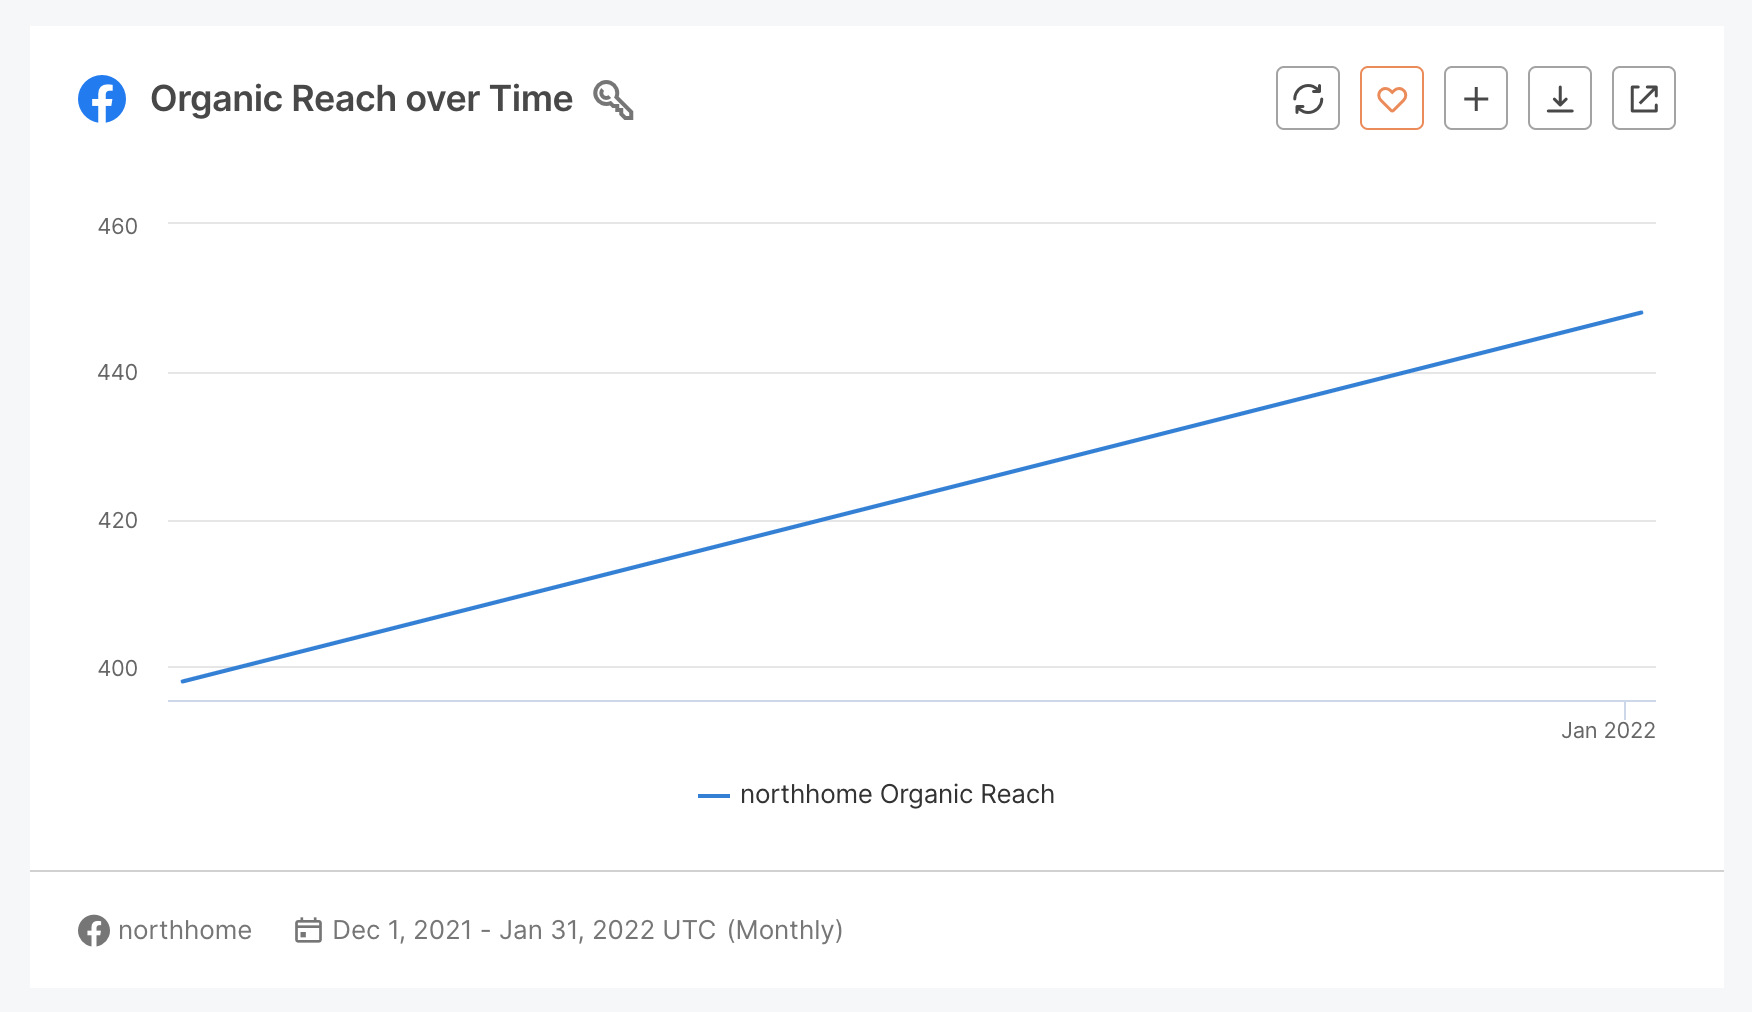
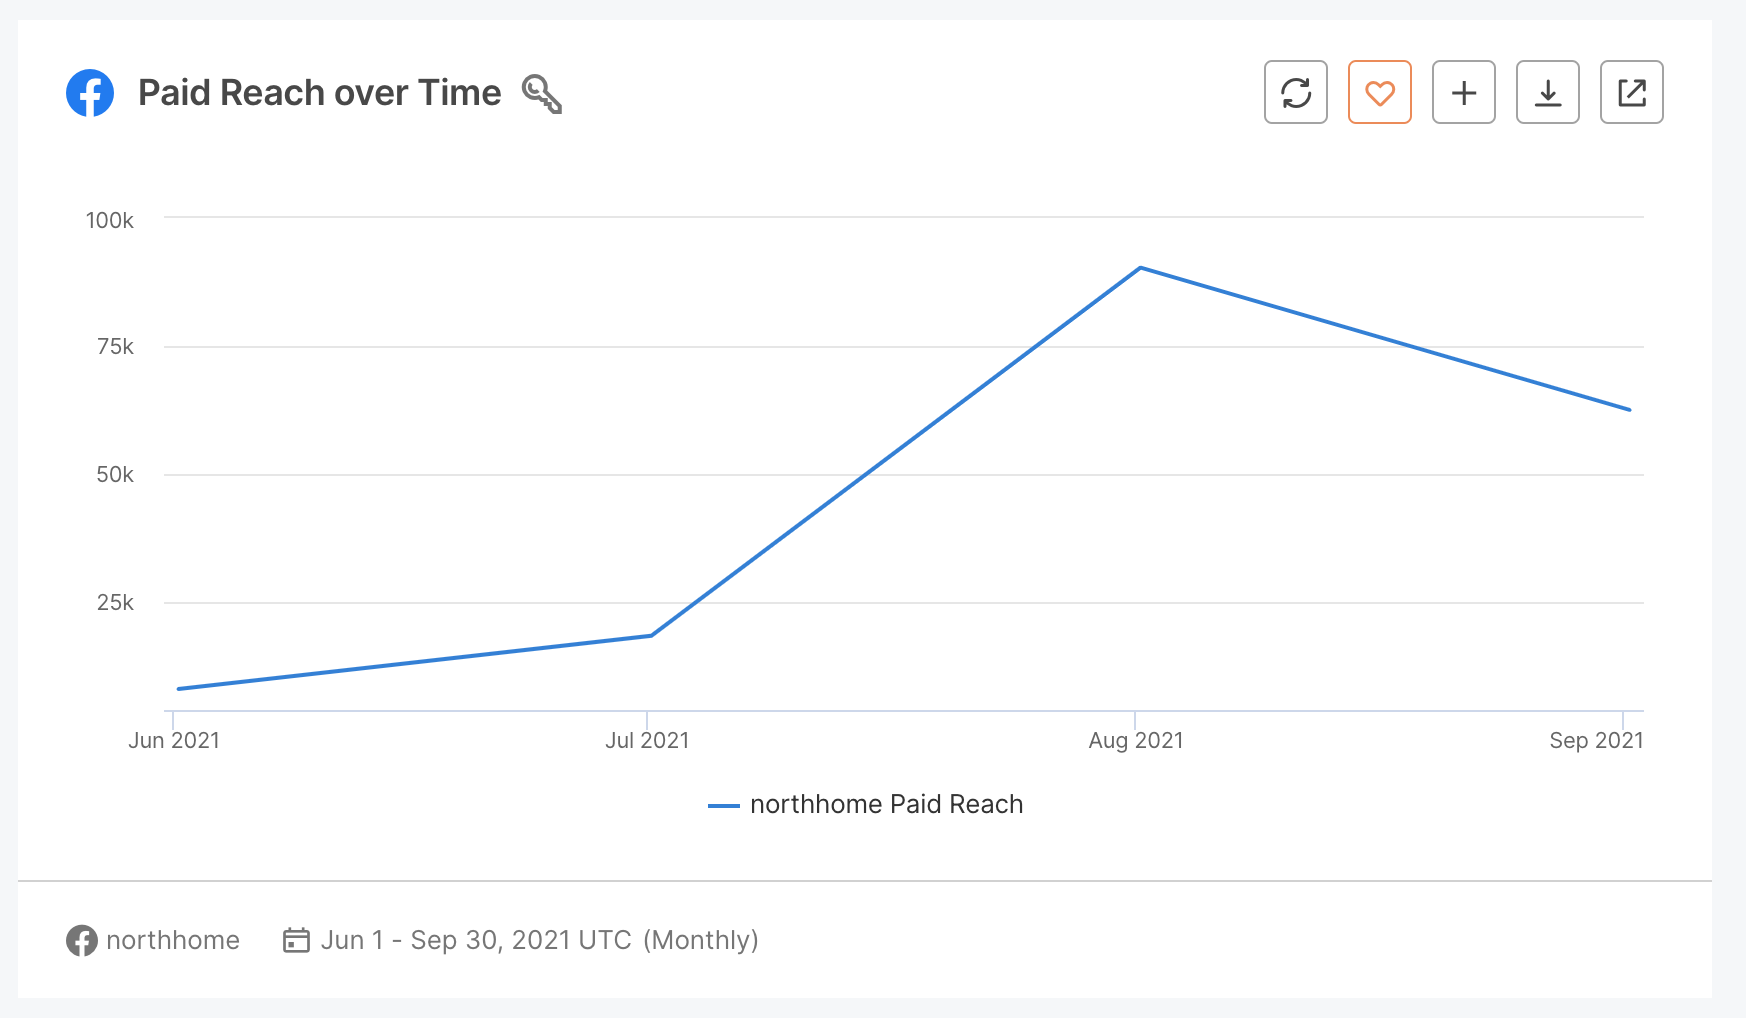
To find out whether you’re getting a good ROI on your paid ads, you’ll want to compare your paid reach with your organic and viral reach.
North Home’s organic reach is highest. They haven’t been running any ads, so there’s no paid reach for this time period.
You can display the same data in a different way with Reach Type Distribution, which shows you the results of the previous 28 days.
Why is your Facebook reach so low?
Worried that your Facebook reach is low? Here are some possible reasons why your content isn’t getting as much reach as you’d like.
- Your content isn’t engaging enough. Facebook’s algorithm prioritizes content that gets more engagement. A lack of interaction signals that your content isn’t interesting enough to display in the news feed.
- Your audience is small. If you don’t have many followers on your page, your reach will be limited.
- You don’t post often enough. Posting regularly is a good way to get more reach.
- You post too often. On the other hand, if you bombard your followers with too many posts, people might mute or unfollow your page.
- You aren’t targeting the right audience. Are you sure that the people you are targeting are likely to be interested in your brand? Make sure your customer persona is accurate.
How to boost your Facebook reach in 3 easy steps
Though it might seem out of your control, there are some things you can do to boost your reach.
1. Get the timing right
If you share content when all your followers are asleep or at work, they’re unlikely to see it.
Make sure you research the best time to post content. This will depend on which country your followers are in and their typical daily routine. It may require some experimentation to find your optimum time to post.
2. Use different post formats
There are many different types of content that you can create on Facebook—stories, images, videos, and live streams.
Mix it up by creating different types of content and tracking the results to find out what performs best.
Remember that Facebook’s algorithm is likely to prioritize native content over external links. That means a Facebook video will probably get more reach than a post linking to a video on Youtube.
3. Focus on engagement
We mentioned before how engagement helps increase your reach.
Here are some ways you can encourage engagement on your posts:
- Ask questions and tell your followers to respond with a comment.
- Invite your followers to ask you questions.
- Talk about trending topics.
- Create a poll and let people vote.
- Set up a challenge or competition, for example, “Caption this image!”
- Find 10 more tips for better interaction with your posts
You can also boost engagement by evoking emotions. People will want to comment on and share content that inspires them, makes them laugh or triggers their curiosity.
Track and increase your Facebook reach
Without knowing your Facebook reach, it’s hard to judge whether you’re getting enough engagement and ROI on your organic Facebook content and ads.
The Facebook algorithm is mysterious— no one knows exactly why some posts get more reach than others. But we do know that to reach as many people as possible, you have to post interesting content, in a variety of formats, on a regular basis. Encourage people to interact, make it shareable and post it at the right time for your followers to see it.
With an analytics tool like Facelift Data Studio, you can analyze every detail of your social media campaigns so you’ll learn quickly what gets the best return on investment.
Find out how Facelift Data Studio can help you dive deep into Facebook analytics and measure the impact of your Facebook marketing using rich data insights.