
You’ve probably wondered what you can do to reach more people with your content on Instagram. After all, more views lead to more likes, shares, follows, and conversions.
The key is Instagram reach - an important KPI that tells you how many people see your posts. Knowing your post reach can put other metrics, like engagement rate, impressions, and conversions, into perspective.
We’ll explain everything you need to know about Instagram reach in 2023, showing you how to track different types of reach, and some tactics for increasing it.
Want to know more? Find out how Facelift Data Studio can help you dive deep into Instagram analytics and get a real impact from your data.
What does Instagram reach mean?
Instagram reach is the number of unique people who see your content. Reach can be tracked in different ways. For example, you can look at the reach of individual posts or your page as a whole. Or you can track reach by post type, weekday, or calculate your average reach for any post.
There are many factors that can influence your Instagram reach. This article will help you understand how Instagram’s algorithm works and what you can do to refine your Instagram marketing strategy.
How does Instagram calculate reach?
Instagram calculates reach by counting the number of individuals who have seen your content. If the same person sees your post more than once, that won’t affect your total reach.
Whenever you post something, it's unlikely that every single follower will see it. Some followers may be less active, and if they don’t engage with your content regularly, the algorithm might not prioritize your posts in their feed.
Is reach more important than impressions?
Both reach and impressions are important Instagram metrics that tell you different things. Reach counts only unique views, while impressions are the total number of views, which could include the same person viewing your post multiple times.
Reach helps you understand how much exposure your content gets. Impressions will always be equal to or higher than reach, so it can be helpful to compare the two metrics. It’s useful to look at impressions as well because they can indicate how engaging your content is.
In Facelift Data Studio, you can track the engagement rate, which is the percentage of engagements in relation to impressions. We calculate this using impressions instead of reach because both engagement and impressions are non-unique numbers, as a user can view and engage with your content more than once.
What is a good reach on Instagram?
When it comes to reach, there is no specific number that you should aim for. A good reach rate will be different for everyone, especially if you're a business profile or personal account.
To give you a benchmark, a Statista study from 2019 found that:
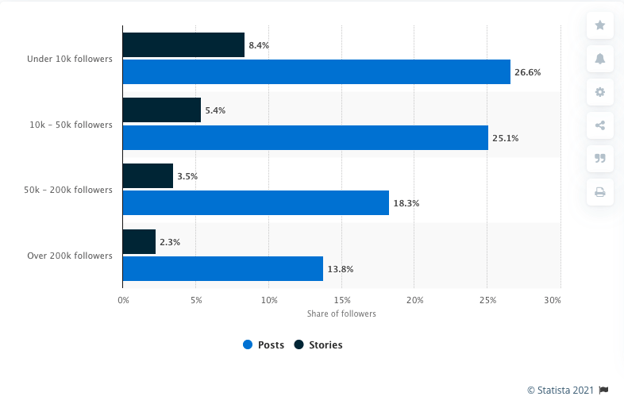
- Brands with less than 10k Instagram followers had an average reach of 8.4% on stories, and 26.6% on posts.
- Brands with 10k - 50k followers had an average reach of 5.4% on stories, and 25.1% on posts.
- Brands with 50k-200k followers had an average reach of 3.5% on stories and 18.3% on posts.
- Brands with more than 200k followers had an average reach of 2.3% on stories, and 13.8% on posts.
You’ll want to be reaching as many of your followers as possible. However, as you can see, accounts with more followers tend to have a lower reach rate.
This data also shows that posts get much higher reach than stories because stories won’t appear on Instagram’s explore pages.
How do you increase your reach on Instagram?
To increase your reach, a good strategy is to play by the rules of Instagram's algorithm.
Instagram’s goal is to make sure that every user gets to see the most interesting posts in their feed. They want to show users content that is relevant to them, and likely to get engagement, so anything you do to boost engagement will have a positive impact on your reach.
Here are some of our tips for increasing your reach on Instagram, and some examples from the Instagram account of the home decor store North Home that demonstrate how to track and boost your reach with Facelift Data Studio.
Want to learn more about tracking metrics in Facelift Data Studio? Check out our complete guide to social media data collection.
Start tracking your total reach
In order to increase your Instagram reach, you first need to start tracking it.
Facelift Data Studio’s Reach metric will show you the total number of unique users who have seen any of your content over time. You can look at your daily, weekly, and monthly total reach to see how it grows over time.

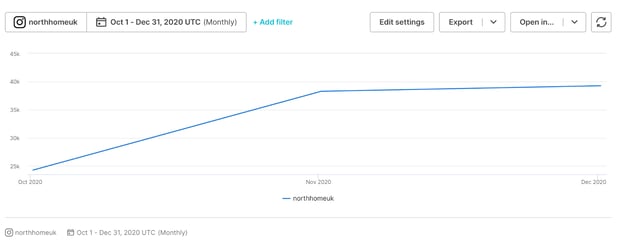
You keep track of page reach by day, week and month using the Page Reach Table.

Share content people love
All the content you post should be relevant and interesting to your audience. You should know who your target customers are, why they follow your page, and what kind of content they like to see.
To find out what kind of content is most successful, track the reach of individual Instagram posts.

The Posts Table gives you a full breakdown of how each individual post performed, including likes, comments, saves, reach, and impressions.
By looking at this data you can see which posts are most successful, and which ones gained the most reach. Over time you will be able to identify what types of posts your audience likes best and start posting more of that kind of content.
You can do this for stories as well.

Aim for engagement
We already mentioned that engagement is key to getting more reach. Craft content that invites engagement from followers and anyone else who sees your content.
Out of the three posts in the image below, the ones that received more engagement also had more organic reach.
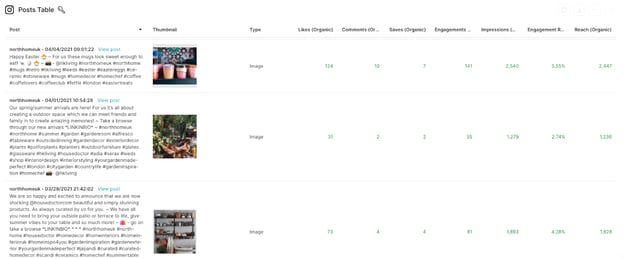
You can use surveys, polls, competitions, or just ask questions. Anything that gets people excited about your business and gives them a chance to participate will boost your engagement and reach.
Get your timing right
It’s important to time your posts well to get them into people’s feeds at just the right moment.
The Instagram feed has not been organized purely chronologically by default since 2016. However, users are still more likely to see newer posts when they open the app and refresh their feed.
If you time posts well and share content when your audience is most active, you increase your chances of being seen. You’ll also be more likely to get likes, comments, and other interactions, and early engagement can help increase your reach.
Here are some metrics that can help you decide when is the right time to post.
If we look at Organic Reach by Weekday in Facelift Data Studio, we can see that North Home usually gets more reach on Sundays, with Friday and Saturday being the least successful days. The Engagement by Weekday graph shows a similar pattern.
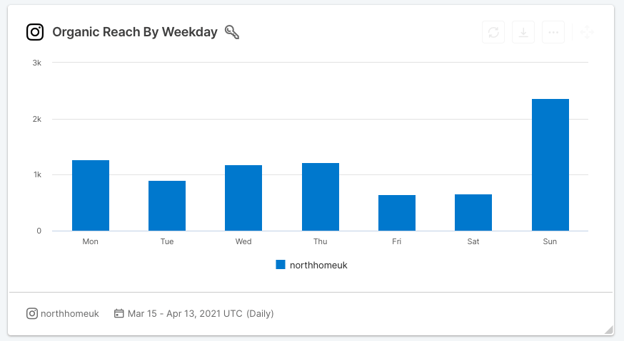

From this data, we could assume that people are more likely to be browsing Instagram, perhaps looking for inspiration for home decor, on Sundays.
It’s always a good idea to test your hypothesis. By sharing content on different days of the week, we can figure out if Sundays really are the best day to post. If the trend continues, you can focus on scheduling your best content for your most successful days of the week.

Another factor to consider is the time of day. Look at top-performing posts in your Posts Table and Stories Table. Do they have anything in common, in terms of the time of posting? You might find that your posts get more reach in the morning, afternoon, or evening, and you can experiment to find out your ideal time to post.
When you have figured out the best time and day of the week to post, you should stick to a consistent posting schedule to make the most of these times. Consistency with posting is another good way to increase Instagram reach, and it works better than posting sporadically.
Hashtags
Hashtags are a great way to introduce new people to your content and help you get more reach outside of your following.
By adding hashtags to posts, you send a signal to the algorithm explaining what your post is about. You increase your chances of appearing on the Explore page and your content can be seen by people who may be browsing certain hashtags.
With Facelift Data Studio’s Hashtag Detection table, you can analyze the performance of content according to which hashtags you used.
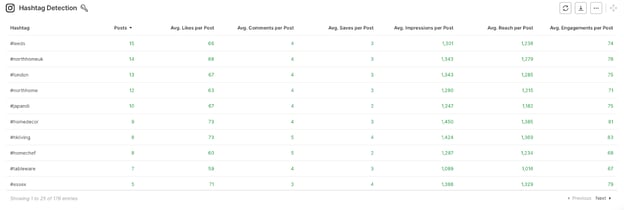
The table shows how many times you’ve used each hashtag, and how much reach and engagement posts using those hashtags received.
When it comes to hashtags, it’s good to use a mix of different kinds of hashtags. Generic hashtags that appeal to a broad audience, trending hashtags that are popular at the time of posting, and industry-specific, or niche hashtags, that people interested in your product are likely to search for.
You can find out more detailed information about how people use hashtags on Instagram, and best practices for brands, in our Instagram Study from 2019.
Try out new features
Whenever Instagram launches a new feature, they want people to use it and get excited about new types of content that can be shared on the platform.
It’s likely that Instagram’s algorithm will favor content on newly launched features, like they did with Reels in the beginning.
Creating a wider variety of content will also help you get more exposure, as some of your target audience may spend more time browsing Reels instead of scrolling through their feed.
It’s worth exploring lots of different avenues, and over time you can track which ones are most successful for you.
In Facelift Data Studio, all of the Instagram metrics now also include Reels. This lets you see reach, impressions, and engagement rate so you can monitor how well your they perform. You can also track public metrics for your competitors’ Reels.
Try different post formats
In our Instagram Study, we discovered that 68% of Instagram posts were single images. 18% were videos, and 14% were carousels, and our research showed that video posts received the most interactions.
However, there’s no guarantee that video posts will get you more reach than images, or that carousels will get more reach than single images. You should experiment with these formats to find out what works best for you.
Let’s take a look at the Organic Reach by Post Type graph for North Home. We can see that single-image posts had the highest reach rate (42.8%) while videos had the lowest (22.5%)
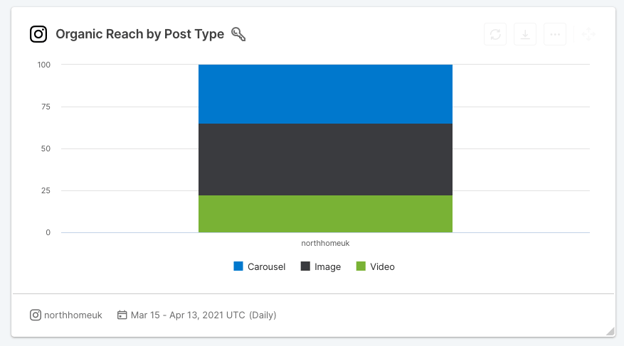
Maybe North Home’s products are more suited to images rather than video. Alternatively, it might just be that they are better at taking beautiful photos.
The key is to figure out which post format is generally more successful for you, and why, so you can create more.
Get deep Instagram insights with Facelift Data Studio
With a powerful social media analytics tool like Facelift Data Studio, you can quickly discover what works and what doesn’t when it comes to increasing your reach on Instagram.
Get started with a free report of your Instagram performance. Share with us your brand's business Instagram profile and we'll send you a free report.
-Aug-22-2023-06-48-25-9421-AM.png?width=700&height=255&name=MicrosoftTeams-image%20(12)-Aug-22-2023-06-48-25-9421-AM.png)

Join the conversation. Leave us a comment below!