When you read these words, chances are extremely high that you use Instagram Stories for marketing your brand. No wonder, it’s currently the most loved social media format. However, evaluating the performance of your stories poses a problem: the data for your stories vanish after 24 hours and you cannot retrieve any information via the Instagram API after that time frame.
Many quintly users have approached us during the last months and asked for historical data on Instagram Stories, so they can show how performance develops over time. We listened and carefully implemented a new solution to preserve the data on Instagram Stories with high accuracy. Here’s what you can expect!
That’s how it’s done
Once you’ve authenticated your Instagram business profile(s) for Insights access, we’ll track your data on Instagram Stories. Every 30 minutes, our system will draw the data for your currently active stories and save them to our database. So when a story expires, the data will be saved with at least near-final performance numbers.
So while your stories are running, and after they expire, you can access various important data points. You’re now able to track Reach, Impressions, Exits, Replies, Taps Forward, Taps Backward and more.
By the way: If you're not a quintly user yet, you can request a demo here to learn more about our features and also receive a free trial version.
We’ve added new Instagram Stories metrics
Until now, it was possible to track Instagram Stories in a dedicated table. From now on, we offer four new metrics that help you get better insights into how your stories perform.
Stories Table
This table offers you an overview of all your Instagram Stories that you’ve published in the given time frame. By also displaying central information on their performance, you can easily identify your most successful content, measured by several central indicators.

Stories Key Metrics Table
The new Key Metrics Table provides you with an overview of the most important data points of your Instagram Stories. For the selected time frame, you can analyze your average performance per profile for all your Instagram business profiles. This makes fast benchmarking of different accounts possible.

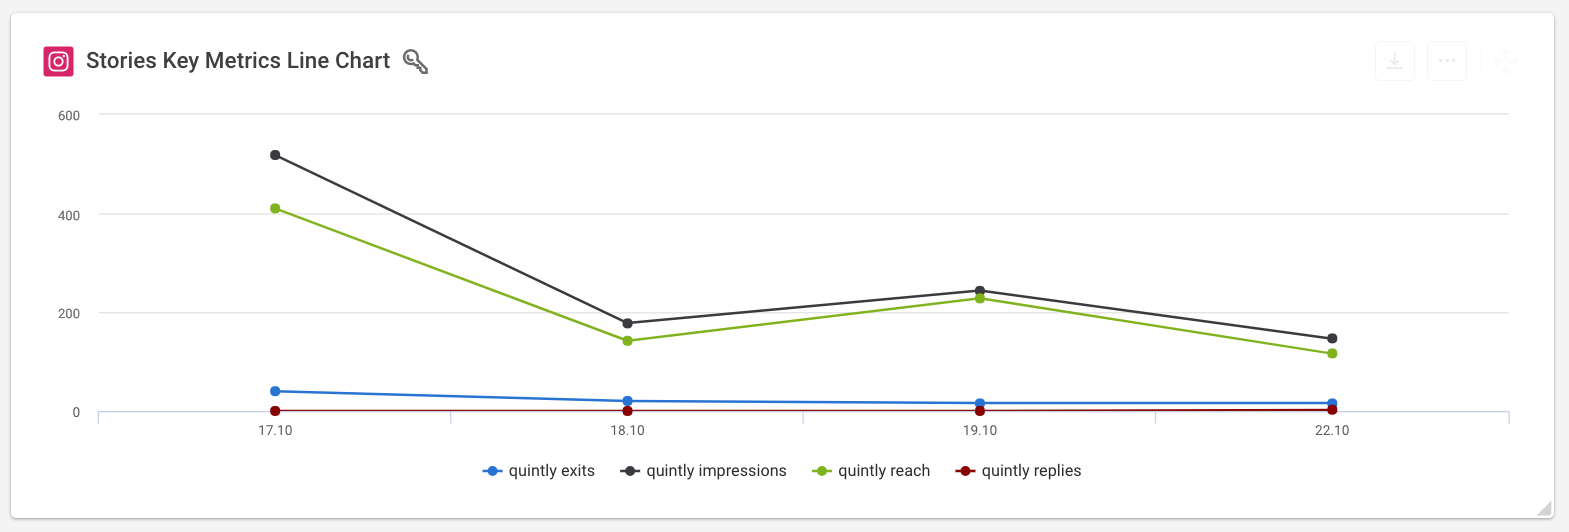
Stories Key Metrics Line Chart
For Reach, Impressions, Replies, and Exits, we also created a Line Chart that helps you understand your performance at a glance. With this metric, you can explore and analyze how your Instagram Stories perform according to most centric data points over time.

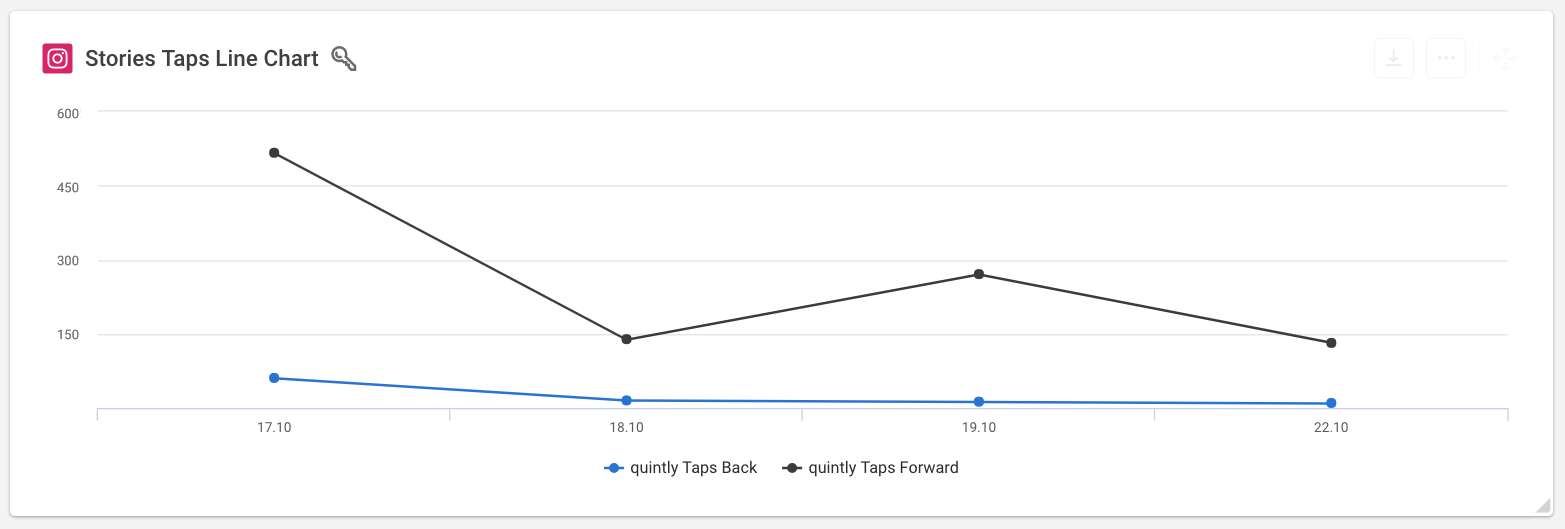
Stories Taps Line Chart
Taps can be a good indicator of how interesting Instagram users find your stories. Should people tap back, they might want to go back to a part of the story they found really interesting. Should they tap forward a lot, that could be a sign that your stories might be too long or not relevant enough. This line chart offers you insights into the tapping behavior for one profile at a time.

Gain better insights with historical data on Instagram Stories
Our clients stand at the center of what we do. With support for historical data on Instagram Stories, we enable quintly users to get much better insights into how their stories perform, thus enabling better data-backed decision making. The metrics presented in this blog post should give you an optimal start in analyzing your Instagram Stories historically.
However, as much as we can build on our social media marketing expertise, we need to hear from you what metrics you prefer! Please feel free to reach out to us via Facebook or Twitter. You can also always send feedback to our Customer Success team via support@quintly.com or me personally via tilo@quintly.com. I hope that this new feature makes your analyses better and easier to set up!
Related Articles
How Instagram algorithm works - Insightful article from Later
8 influencers share 8 ways to make your Instagram story more engaging
Learn from the best - NYT on Instagram
Don't waste money! Instagram Ad Analytics


Join the conversation. Leave us a comment below!