
Instagram has 1 billion monthly active users worldwide. It is the main communication channel for a lot of brands and influencers – they announce new products and partnerships on the platform and, at the same time, they have the chance to stay in touch with their audience. Private accounts, on the other hand, often use Instagram as their visual diary.
So how are all of these accounts using the platform and what kind of content really drives engagement? We decided to take a deeper look into the data and analyzed the performance of 34,121 Instagram Business Profiles and 5.4 million posts between January 1st and June 30th, 2019.
Let’s take a look at some our results in this year’s Instagram Study!
Data set and main focus of the study
To give you a better overview of the data, we sorted the profiles into six different groups for the whole analysis. This way, you can more easily apply the findings to your own account: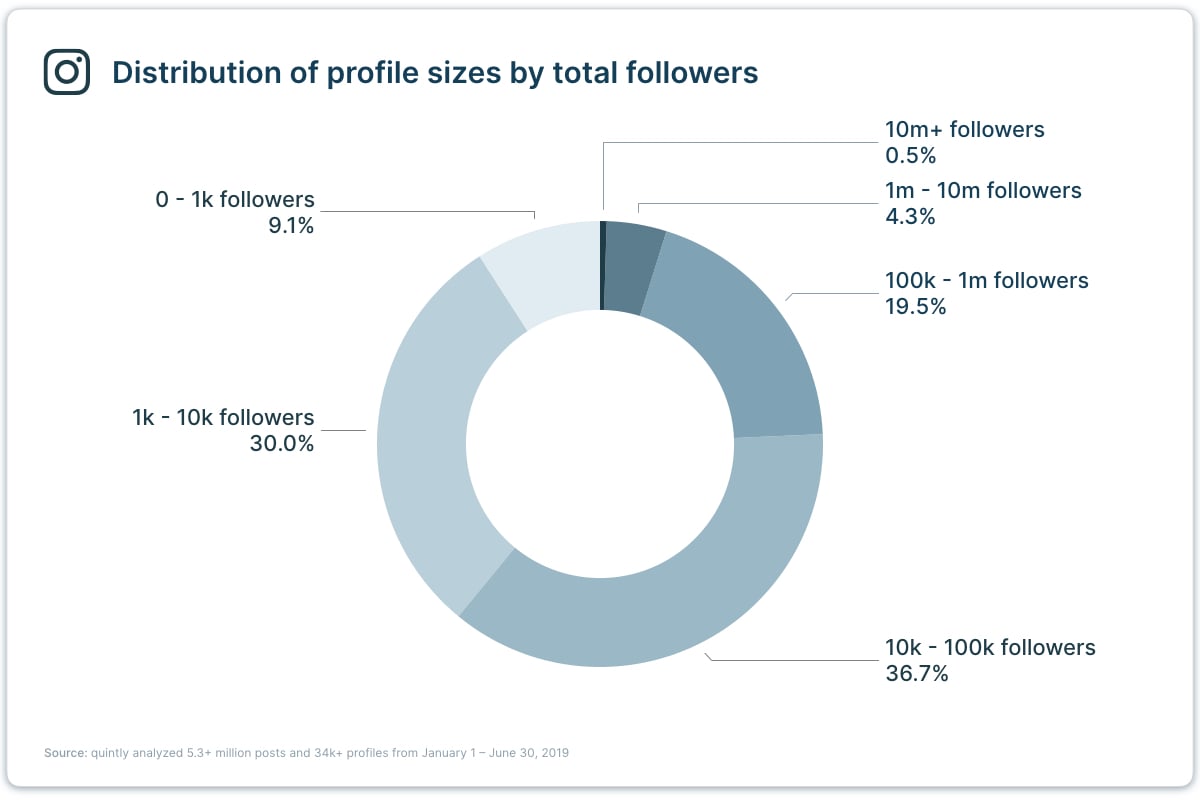
Here are the six topics that we focused on in our study:
- Growth Rate
- Performance of Post Types
- Caption Lengths
- Analysis of Hashtags
- Emojis usage
- Performance of weekday and weekend postings
Now let’s head over to the data!
Profiles grew to 16%
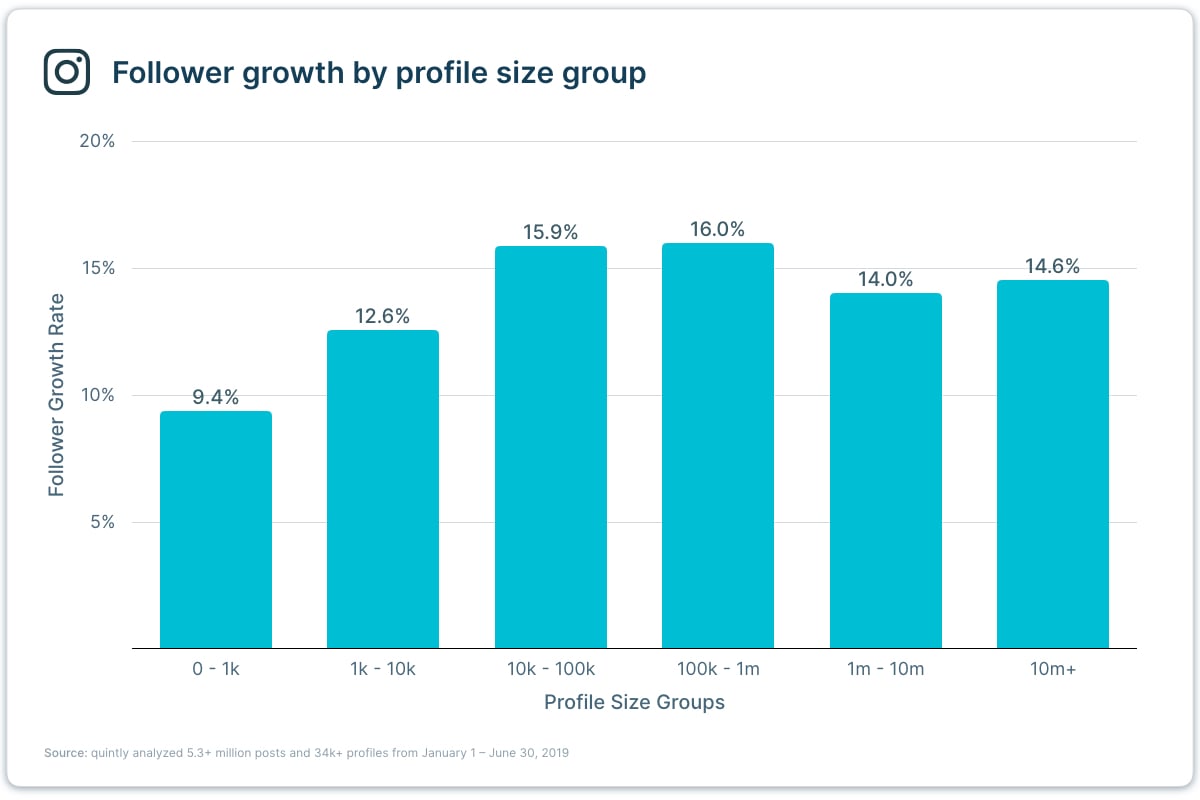
Instagram is growing every day and it doesn’t look like stopping anytime soon. What gives us this idea? We detected an overall fan-growth in every analyzed profile group.
More precisely, the analyzed profiles managed to grow between 9.4%-16% in just half a year!
68.2% of all posts are single images
Instagram users have the agony of choice between publishing single images, videos and carousels. Every post type has its own unique way of telling a story and engages with their audience in a different way.
Now how does the share between all profiles exactly look like?
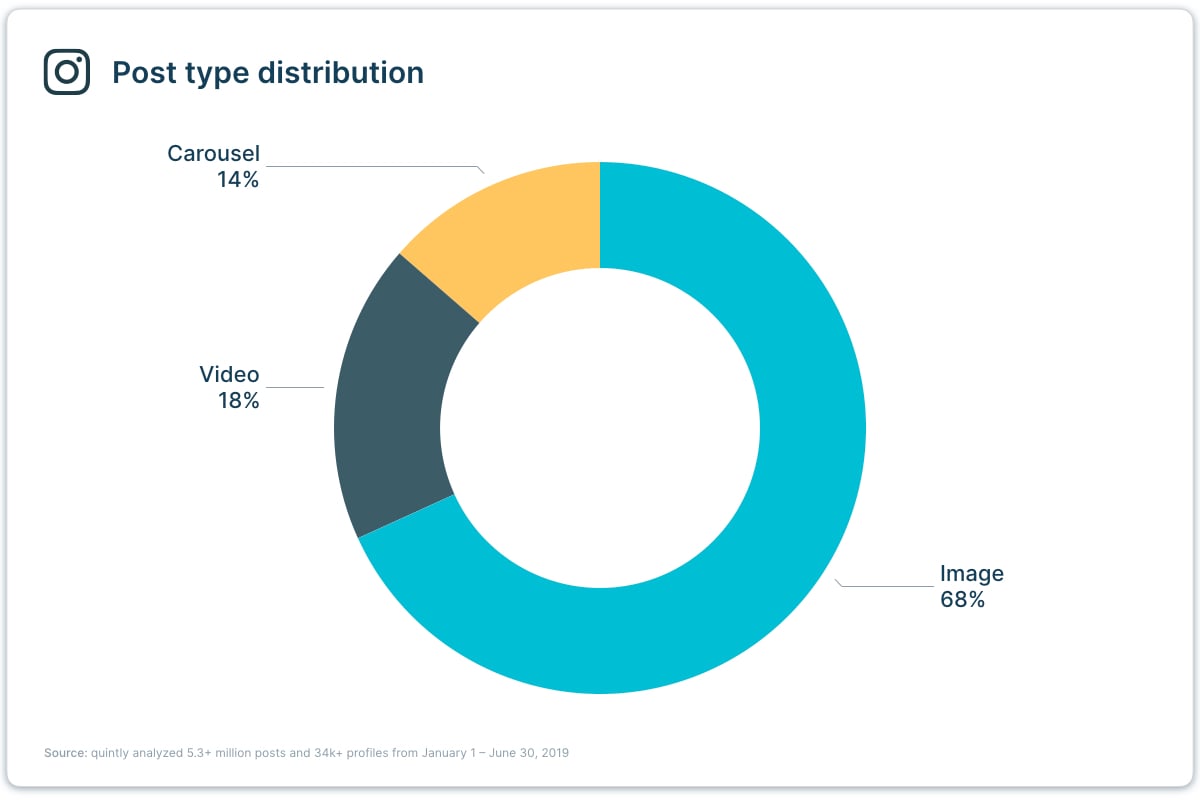
Single images represent the primarily used post type on Instagram with a share of 68%. They are followed – at a distant second – by video posts with a share of 18%. Carousel posts bring up the rear with just 14%.
Would you like to know which post type got the most interactions? Find it out in our study.
150 characters and more are used in 67% of posts
It seems that a lot of profiles put a lot of thought into the captions they write for every post when you see the findings of our study: 30.8% of posts contain 150-300 characters in their post description and even 35.8% used more than 300 characters.
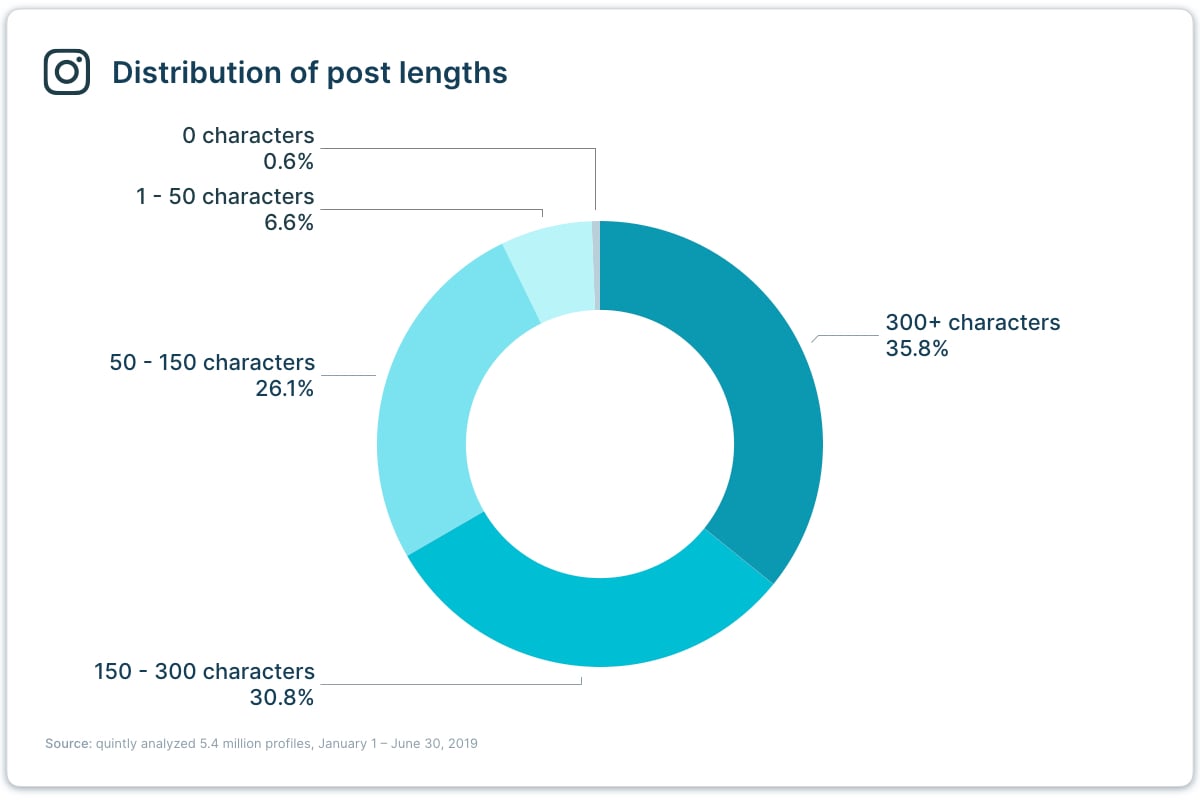
We decided to dive deeper into this topic to find out how the chosen profile groups really used the different post lengths.
So if you are interested in finding out how many characters in a caption attracted the highest engagement for each group, head over to the full study.
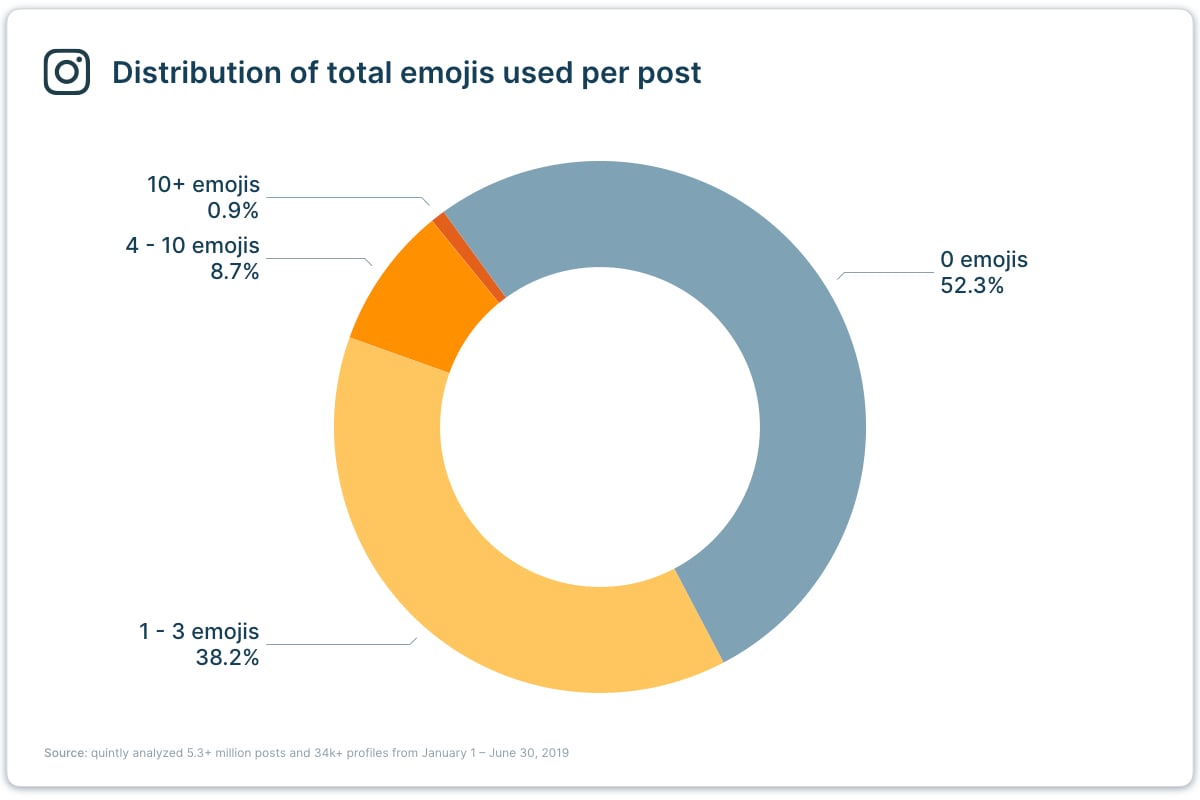
More than 50% of all posts don’t include emojis
Face With Tears of Joy 😂, Loudly Crying Face 😭 and Smiling Face With Heart-Eyes 😍 – yes, those are the most popular emojis and it seems like you see them everywhere, right?
Surprisingly, our data set revealed that 52.3% of the analyzed posts didn’t include any emojis at all. Now, is it really the right choice not to integrate emojis in your social media communication? We took a further look into this topic in our study.
1-3 hashtags are most used in posts
If you want to make your content more visible and reach a wider audience that might be interested in your content, hashtags are the way to go! They are a vital way to easily find your posts on Instagram.
But how are hashtags being used on Instagram? Let’s dive into the data:
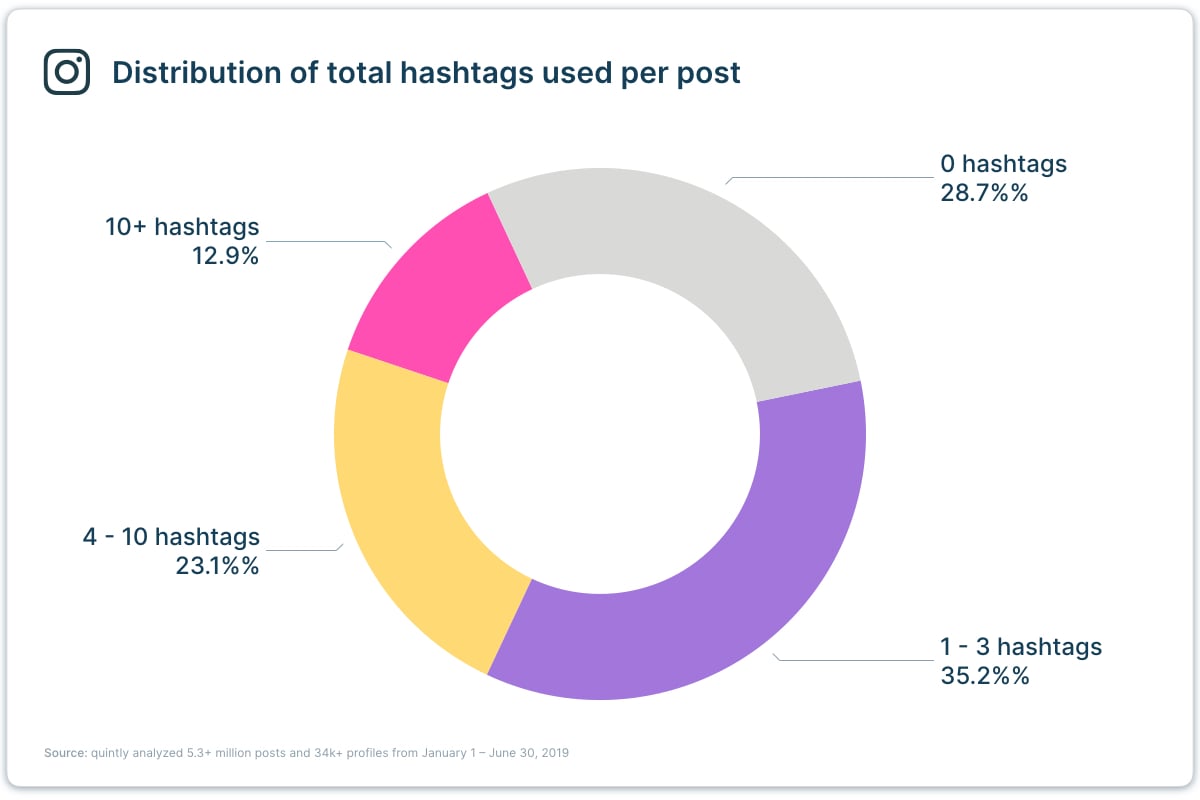
Because we got curious about how the different profiles use hashtags and what number of hashtags works best in terms of engagement, we took a deeper look into the data in our full study.
Weekend or Weekdays? When do posts tend to receive higher interactions? Access the the answer to this question in our Instagram study 👇
Let’s test!
I hope you found our study helpful. Maybe you could even extract some useful insights for yourself.
Please keep in mind that the results of our study are averages within our specific data set – even if it consisted of more than 5 million posts. Applying our findings will not directly positively influence the performance of your profile.
Take them as inspiration for your own Instagram strategy. Please don’t forget that every Instagram profile works in its own way and, therefore, it’s necessary to keep testing and analyzing the performance of your account. This is the most accurate way to discover what benefits your account and what your followers react to.
Do you have any best practices to share with us? Leave us a comment and tell us how you utilize the platform for your own benefit. Looking forward to hearing from you.
Recommend Readings
Guide to Social Media Stories and Short-form Video Content
40 social media buzzwords every marketer needs to know
How to collect customer feedback with Instagram Stories
6 Hacks that will take your Instagram Stories to the next level
How to analyze Instagram Stories
Social Media Marketing Tactics and Strategies for SMEs
How do Instagram Insights work?

Join the conversation. Leave us a comment below!