Today we want to welcome you to a classic duel when it comes to brand duels. In this social media duel the two counterparts are Coca-Cola and Pepsi. This two companies were already compared in categories such as taste or award. As the name of the article suggests, this duel is about the social media presence. Just like in our last social media duel, only the main pages are taken into account for this epic battle. This means that pages just like Pepsi Max or Coca Cola Zero are not considered. Now that all prerequisites have been clarified it is time to start with the analysis, so…
…Let The Battle Begin
To give us an overview at the beginning we take a look at our Facebook key metrics radar chart. This metric is great to get a quick summary about the overall situation, since the radar plot includes the most important Facebook metrics (fan count, number of own posts, number of interactions, interaction rate, average People Talking About This (PTAT) rate and the Fan - Growth - Rate.
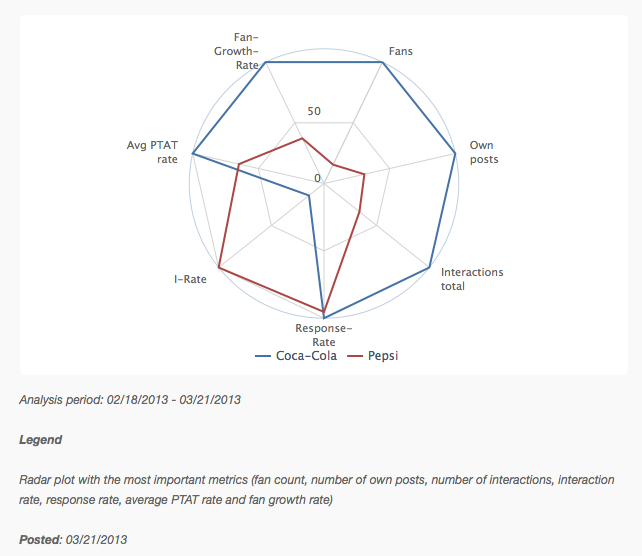
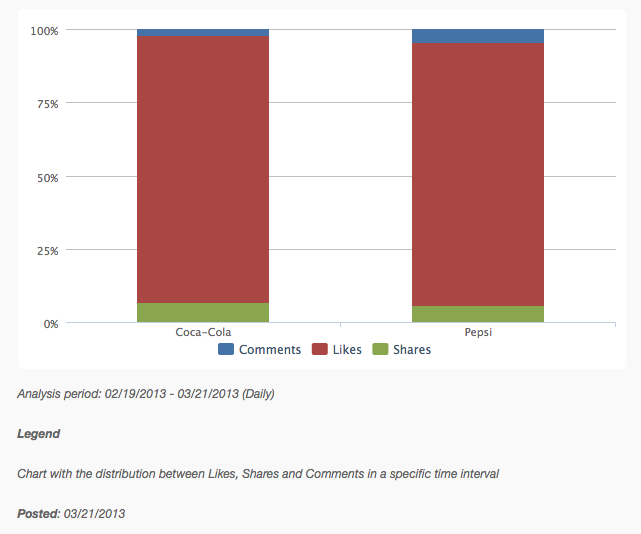
It looks like Coca-Cola rules in front of Pepsi. In five of seven categories Coca Cola strikes against his main competitor. The biggest difference between the participants we find is the total number of fans. To be precise the Coca Cola page has 61m fans and the Pepsi page has only 9m fans, which means that Coca Cola is 52m fans ahead of Pepsi. The only category in which Pepsi takes the lead is the interaction rate, but this is not really surprising when we remember the number of fans. Another graph that looks very interesting is the interaction distribution chart. As you can see in the chart below the interactions on both sides are split up in nearly similar sized part.
Now that we know the most important data from Facebook it is time to focus on Twitter.
The Social Media Duel On Twitter
In this chapter we want to start with the followers total. A real surprise - Pepsi beats Coca Cola with large projection.
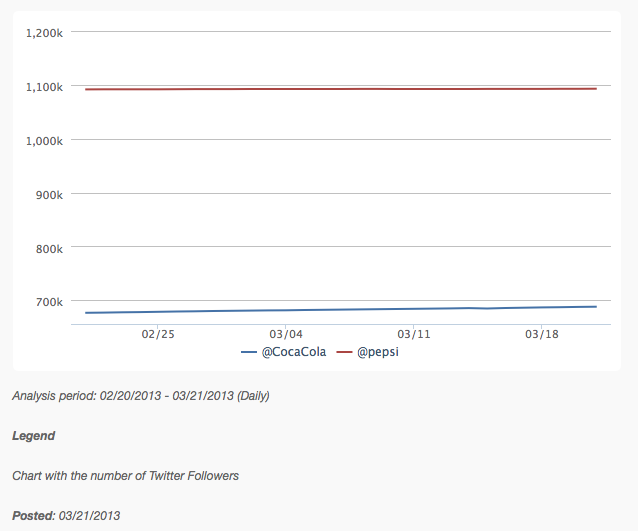
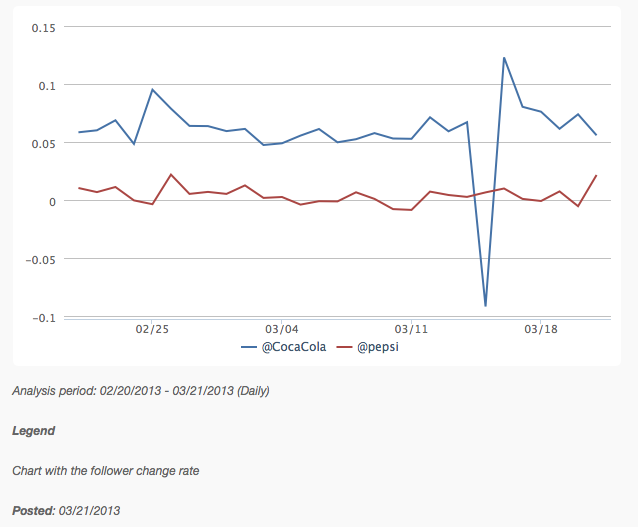
However, what should be mentioned is the fact that Coca Cola has a larger follower growth. Expressed in numbers this means the following:
| Picture | Page | Follower total (02/21/2013) | Follower total (03/21/2013) |
| Coca Cola | 676,824 | 688,111 | |
| Pepsi | 1,091,640 | 1,092,847 |
To support these numbers visually serves us the follower change rate. In this graph we can clearly see that Coca Cola got a higher growth rate for most of the time. Only at the 15th of March apparently something went wrong on the Coca Cola Twitter profile. On this day Coca Cola lost more than 600 followers which corresponds to a follower change rate of -0.0918%.
In conclusion to this social media duel it can be said that the soft drink giant Coca Cola is doing a really good job in the social media universe. This should not diminish the social media influence or the work from Pepsi but Coca-Cola has the better statistics.
What is your opinion about this duel and who would you like to see in the next social media duel? Tell us your opinion and leave a comment.

Join the conversation. Leave us a comment below!