
Your clients are eager to know exactly what’s happening with their social media accounts. They want proof that your strategies are working, and they want to see rising follower counts and high engagement rates.
The challenge for marketing agencies is demonstrating those results - and that’s where social media reporting comes in.
A social media report is the best way to distill all the data and metrics you collect from clients’ social networks into a digestible format. They help you and your clients get context and insights that keep your campaigns on track.
Compiling a report from scratch takes time. And, there’s no one-size-fits-all approach. Every client has their own specific needs and metrics to track.
To help you get started, we created a social media report template that you can use as a sample and tailor to your clients’ needs. This will help you speed up the process and create engaging custom reports.
We’ll also explain all you need to know about social media analytics reporting, including:
- What your report should contain
- How often to create reports
- Collecting and presenting your data, either manually or automatically with a social media analytics tool like quintly
- Tailoring the report to your audience
If you want to make the process even easier, learn more about creating highly customizable automated reporting with quintly.
What should be included in a social media report
A great social media report should be brief enough to keep clients engaged, while still including all noteworthy information.
To impress your clients with engaging reports, here are a few things you should consider including:
1. Introduction to your social media report
Begin by reminding your clients what you’re doing and why. Talk about their social media marketing goals and KPIs, and the tactics you’re using to achieve them.
This helps to set expectations and keep objectives top of mind, providing some background for the data that follows.
2. Most relevant data
If you’re using a social media reporting tool such as quintly, you can track hundreds of metrics and even create your own. However, you probably don’t need to include every single one.
This is where customization comes in. Make sure your report is tailored to whatever KPIs you have set. Include the most critical data that shows whether you’re hitting them.
For example, if one of your KPIs is to boost engagement and follower count on Instagram, include all the metrics that would measure that KPI.
Sometimes you may include interesting details even if it’s not directly relevant to your KPIs. For example, if you’ve had a Facebook post go viral, or received an influx of new Twitter followers, you should mention that in your report.
3. Metric summary
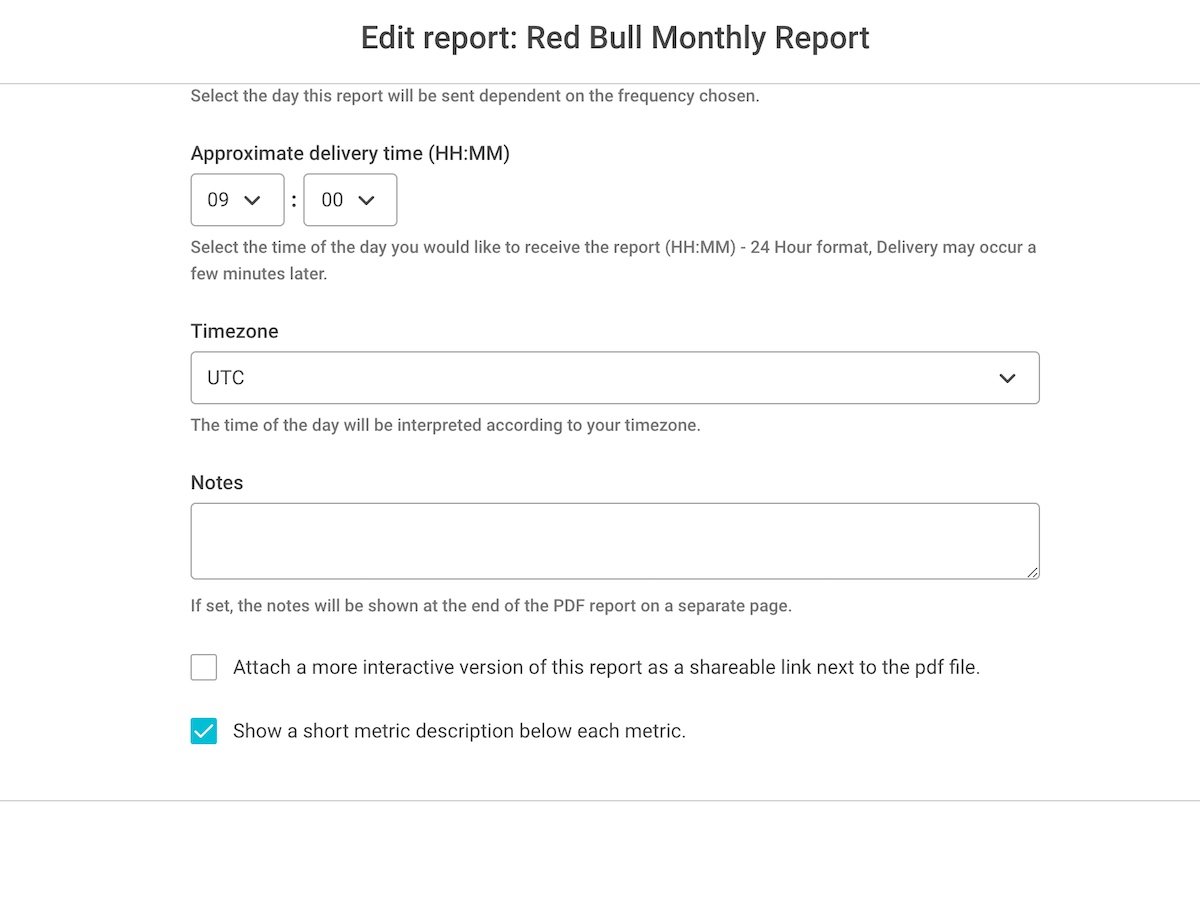
For clients who are less data-savvy, it’s good to include a description of all the social media metrics that feature in the report.
That will clear up any confusion about what the metrics mean when your clients refer back to the report. When creating your report in quintly, you can choose to include metric summaries.
4. Data by channel
It’s useful to break down data by channel, especially if your clients have decided to prioritize particular networks.
Compile a variety of metrics for each channel so that your clients can get a detailed look at how they’re performing.
This will help you confirm which channels are most valuable and worth focusing on.
5. Visuals
Graphs, pie charts and other visuals help bring your social media data to life and keep your clients’ attention glued to your report.
Chances are you’re handling a lot of complex data, so you need to present it in a compelling way.
Of course, don’t forget to include your company logo and branding in your report. If you’re using quintly, you can choose a white label option that allows you to produce a branded report.
6. The conclusion to your social media report
After presenting the data, summarize your findings and extract meaning from the numbers.
Help your clients understand why things are happening, and what you plan to do next.
Back up your ideas with evidence so you can move forward with a data-informed strategy.
How frequently you should report on social media data
Your clients may expect regular updates, so it’s important to establish how often you will run reports.
- Weekly or monthly reporting is frequent enough for you to spot positive trends or correct problems before they get out of hand.
- Quarterly reporting gives you a chance to take a broader look at your data and spot overarching patterns. KPIs are often set quarterly, so these reports will fit on the same timescale and let you measure whether you’ve hit them or not.
- Annual reports tie in with larger company objectives. They should be more detailed and analyze every aspect of your clients’ social media performance over the past year.
- Per campaign reporting: some clients may contract your services to run specific marketing campaigns, and these reports should focus strictly on data relevant to that purpose.
For many clients, you’ll have to report on a weekly or monthly basis, and provide quarterly or annual reports as well.
How to compile a social media analytics report (template)
And now, let’s talk about putting together a social media report that will impress your clients.
Once we’ve covered the basics, we’ll share with you the social media report template we created so you can customize it to your needs.
What KPIs you should include in your social media report
Before you start creating a social media report, you need to know what KPIs to track.
KPIs should always be tied to your clients’ overall business goals and help you measure whether you’re helping to achieve them.
We’ve written a whole article on the top social media KPIs to track for agencies.
Here are a few important ones to include (depending on your client’s goals):
- Total Follower Count for Facebook and Instagram
- Retweets and Mentions on Twitter
- Youtube Subscribers and Video Views
- Hashtag Detection for Instagram
- Overall Top Pages and Overall Audience Change Rate for cross-network analysis of all your clients’ social profiles
Provide competitive context
How do you know the number of followers you should aim for if you don’t know the industry average?
Can you be certain your clients are getting a good return on investment on paid social ads if you don’t know the average ROI for that channel?
Social media interactions don’t happen in a vacuum. If you don’t look at the wider context behind what’s happening on social, you can’t understand the meaning behind your clients’ data.
Competitive benchmarking is the way to give context to your clients’ social media performance and help them understand how they measure up to their competitors.
As well as cross-network analysis, it’s a great idea to include a competitor analysis to highlight how your client measures up.
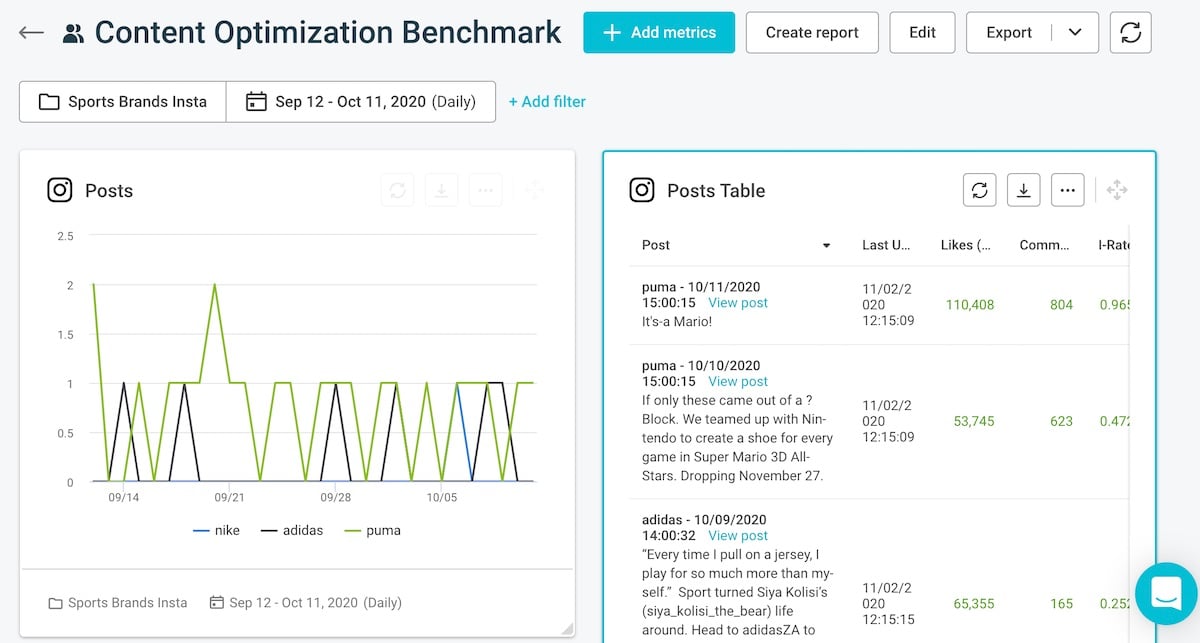
quintly has dashboards dedicated to competitive benchmarking and cross-network analysis that will help you collect public data from other companies and across all your social channels.
Know your audience
To create a meaningful social media report, you need to be familiar with who you are presenting your report to. It may affect the information they want to see and the way they would like it to be presented.
For example, if you send reports to your client’s marketing team, you can focus more on the metrics themselves and trust that they will understand the ROI.
However, when reporting to key stakeholders in the company or executives, you might need to make sure you avoid marketing jargon and focus on the social media strategy, conversions and financial results.
How to create a social media report manually
Manually compiling any social media report is hard work, but it can be done. We’ll show you how to get started.
First, collect data from the social media networks that your clients want to track. You can use the native analytics tool of each platform and enter the numbers into a spreadsheet.
Facebook Insights
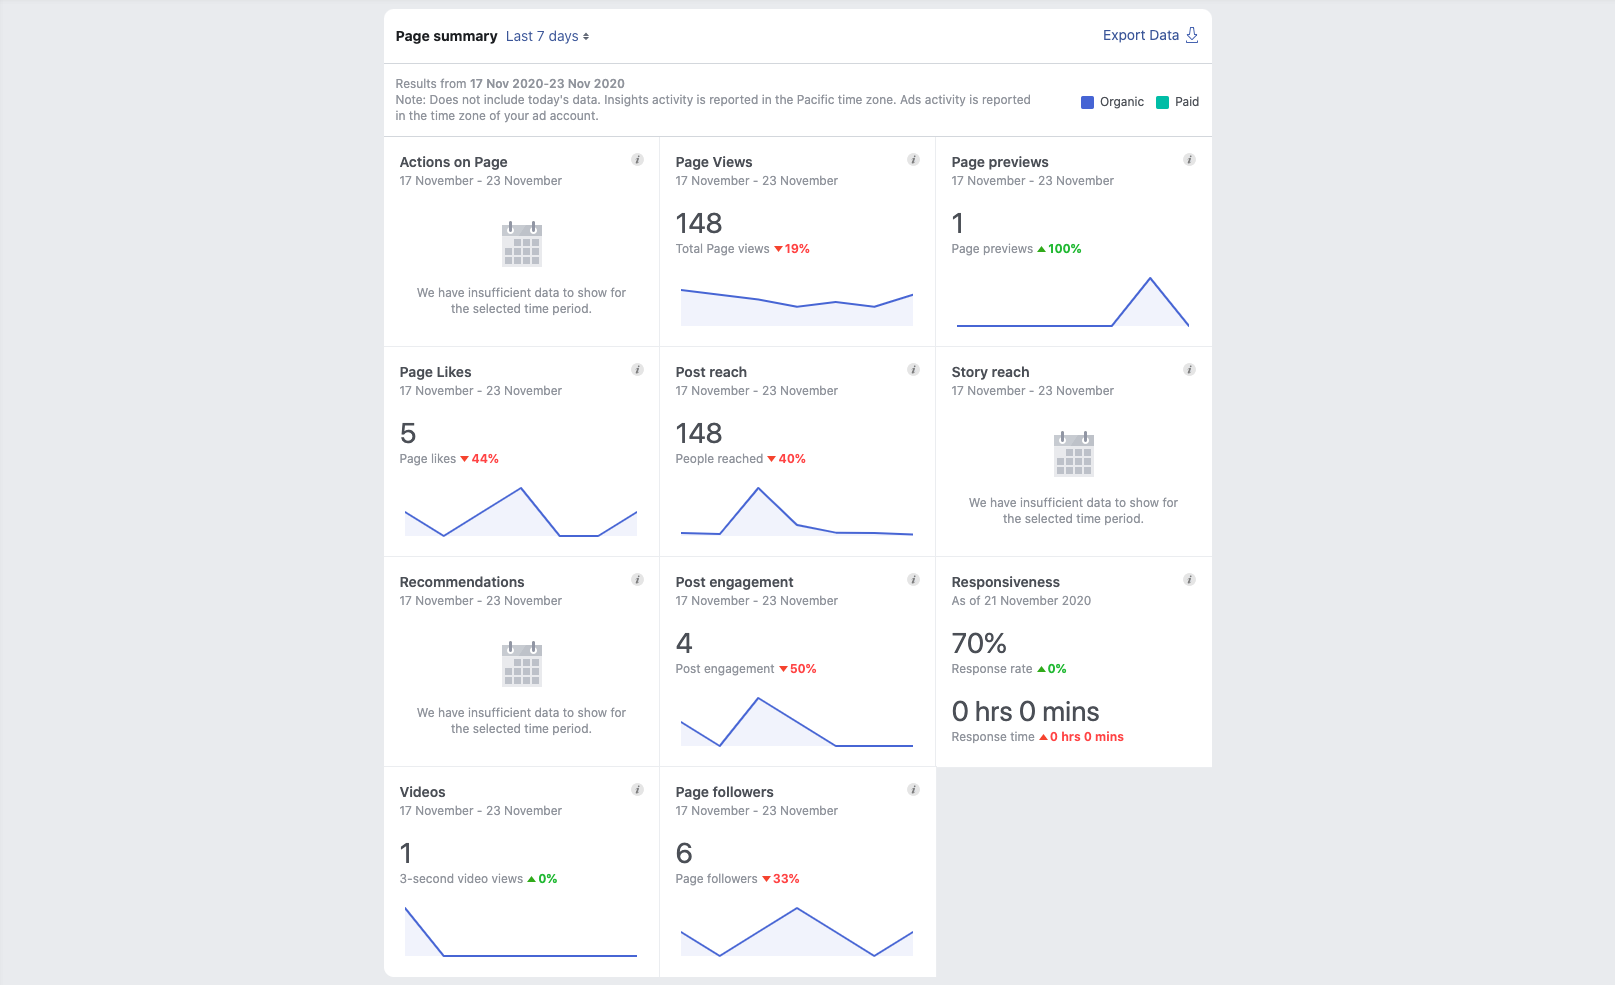
For Facebook Insights, go to your Facebook page and click insights on the menu. Here you’ll get a summary which includes key metrics like page views, page likes, and post reach. You can open up any of these metrics to get deeper insights - such as characteristics of the people who've viewed or liked your page.
Instagram Insights
To see your Instagram Insights, go to your profile and click on the Insights button. Just like Facebook, you’ll get an overview of important metrics that you can explore to learn more.
Twitter Analytics
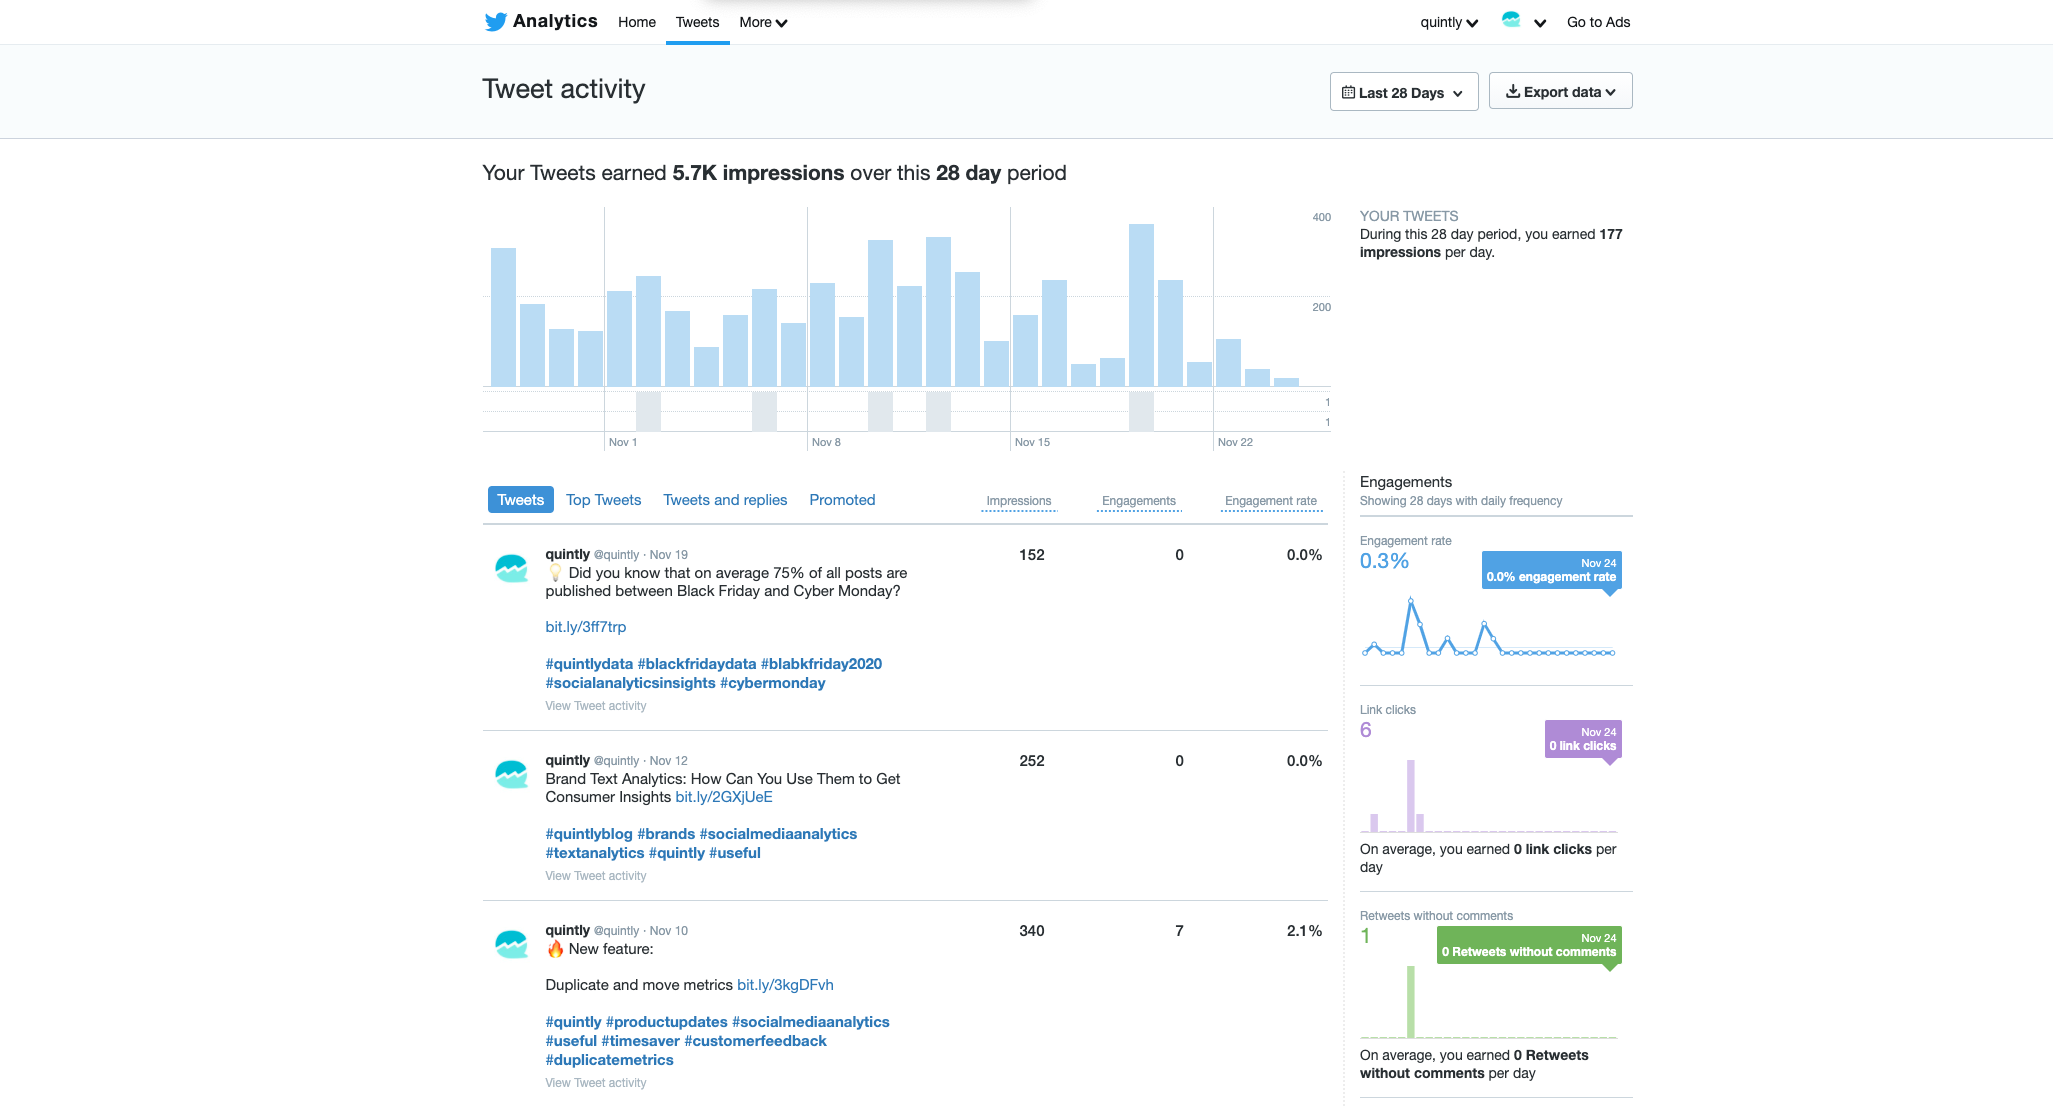
In your Twitter menu, go to Analytics. There you’ll find a dashboard with a variety of metrics including impressions, engagement and clicks. You can export this data as a CSV file.
LinkedIn Page Analytics
You can view your LinkedIn Page Analytics in the page admin view, or analytics module. There you’ll find information about demographics and where your followers and profile viewers are.
YouTube Analytics
To view your Youtube Analytics, go to the YouTube Studio app. From there, you can see your dashboard as a whole, click on videos to see stats on individual uploads, or view channel analytics where you’ll see data about watch time, subscriber count, reach and engagement.
Snapchat Insights
Find your Snapchat Insights by going to the app’s home screen and clicking on your bitmoji in the top left corner. Then, tap on the insights tab to access your Snapchat data. Here you’ll find metrics such as story views, view time and subscribers.
When you’ve collected all your data, you can use this free social media report template as a starting point to assemble your findings. It gives you a sample structure that you can fill with your own data and customize however you like.
How to create an automated social media report
Compiling manual reporting is not impossible, but it’s inefficient and time-consuming.
- Firstly, you have to log in to each social media account separately to retrieve the data you need for your report. If you work with multiple clients, you could be wasting hours per week doing just this.
- Secondly, you need to export the data from each account, or take screenshots. Bringing together data from different sources to compile a report can end up looking messy and unprofessional.
- Thirdly, the data you collect will be in different formats. For example, engagement rate on Facebook doesn’t mean the same as engagement rate on Instagram. This makes it hard to compare data from different sources, which is a key aspect of reporting.
If creating social media reports manually sounds like too tedious a task, consider analytics tools.
You can easily generate an automatic report with a social media analytics and reporting tool like quintly.
For example, quintly lets you:
- Quickly create automated reports, and set them up to go out on a regular basis.
- Do all your analysis and reporting in one place. quintly supports a wide range of social media platforms including Facebook, Instagram, Snapchat, LinkedIn, Youtube and Twitter.
- Collect clean data that’s in a standardized format and ready for cross-network analysis.
- Set up custom dashboards to track only the most important metrics that line up with your clients’ KPIs.
- Create custom metrics from scratch, or by modifying pre-built templates, so clients can see the exact data they want to see.
- Customize each report to fit your clients’ needs. quintly offers a wide range of customization options and export formats so you can create a report that’s tailored to your needs.
quintly is unique in comparison to other social media reporting tools thanks to the wide range of data that you can collect, and its ability to clean and standardize that data for easy comparison.
How to create a social media report in quintly
To set up a report in quintly, choose a dashboard and go to “create report”. You can select the frequency settings and customize your report.
You can choose from a variety of reporting formats including a link with an interactive report that lets your clients browse the data in an intuitive way.
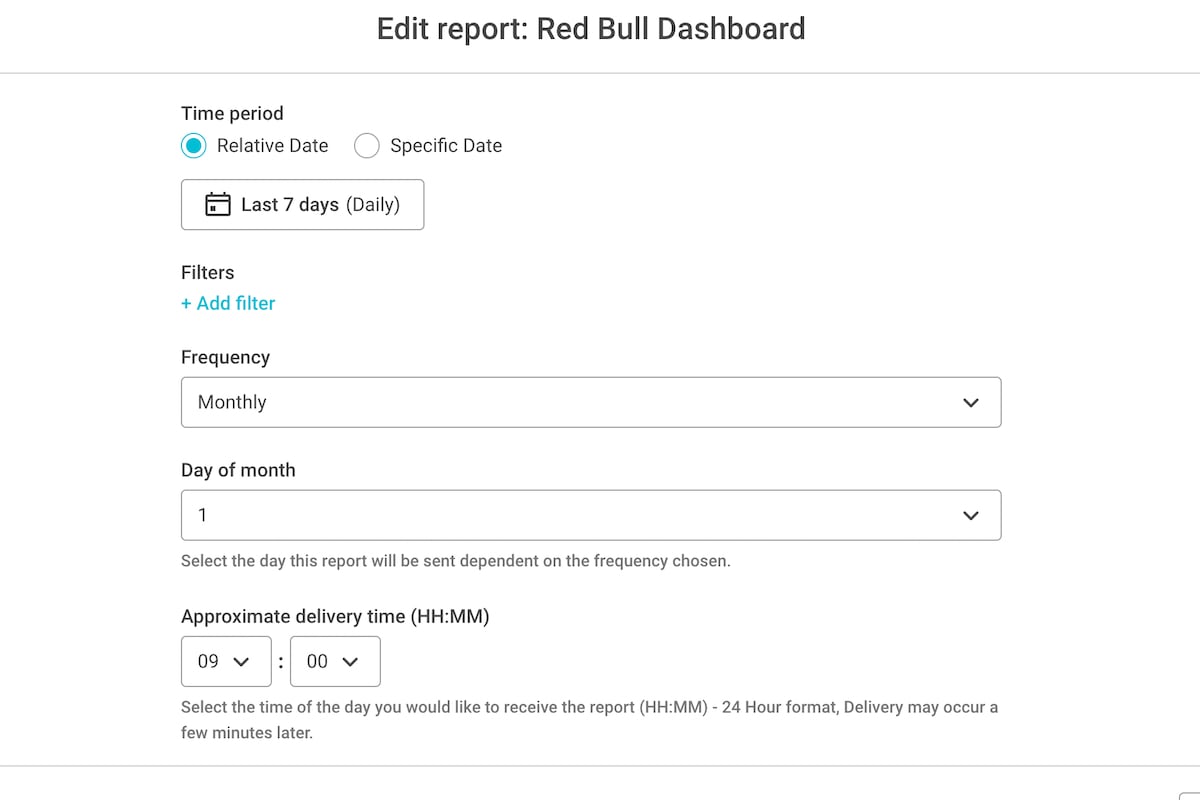
Automated reports help you achieve better quality reporting with less time and effort. Sign up for a demo to see quintly’s unique reporting feature in action.
Social media report template
To help you create a social media report that will delight your clients and demonstrate your value as a marketing agency, we’ve created a handy template in Google Slides.
Remember, there’s no one-size-fits-all solution to reporting. Use this free template to give you ideas on how to structure your report's content and what to include, but feel free to change whatever you need. Just make a copy and start tweaking!
When you’re ready to start automating, try quintly’s social media reporting.
With quintly, you can stop manually scraping data from all your clients’ social media profiles, and start whipping up comprehensive reports with minimal effort.
Automate the reporting process and generate user-friendly, easy to understand reports that will impress any client.


Join the conversation. Leave us a comment below!