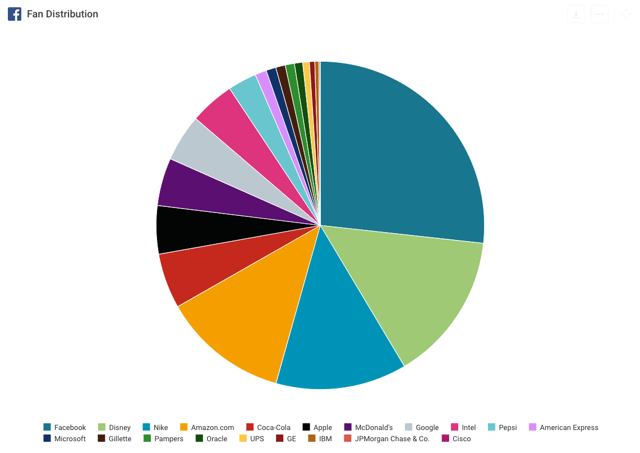
Social media usage around the world is soaring and has probably not even reached its peak yet. It’s no wonder—all of us marketers want a piece of the pie, and we invest a lot of time into social media marketing. We were wondering how the big brands use this huge potential for outreach, so we analyzed the social media activities for the 20 biggest and most important US brands (according to Interbrand) in 2017. All results are summarized in the US brands social media report we created.
Brands we looked at:
| Apple |
|
Microsoft |
Coca-Cola |
| Amazon.com |
|
General Electrics |
IBM |
| McDonald's |
Disney |
Intel |
Cisco |
| Oracle |
Nike |
Pepsi |
Gillette |
| American Express |
Pampers |
UPS |
JP Morgan |
How Do Large US Brands Use Social Media?
We chose to analyze data for the whole year of 2017, including Facebook, Twitter and Instagram as the most relevant networks out there. All in all, we looked at eight important key performance indicators (KPIs) to break up how the brands use social media and how they ultimately perform. In four categories, we compiled data for you about followers, content, engagement and customer care.

As a result, we found some interesting facts. For example, Apple was running channels in all three networks by the end of 2017. However, they don’t post anything on either Facebook or Twitter, while still having a big follower number that can compete with the brands that actually use social media actively. They also receive a high volume of questions from users, but don’t choose to answer them.
On the other hand, Disney is a stunning example of how well you can use your existing brand awareness factor combined with the fact you are already a big content creator. Disney posts the most content by far on any of the analyzed networks and also achieves the most interactions with this strategy. However, this is not a normal effect—our previous analyses have shown that some organizations just decrease the average interactions per post if they tend to publish a lot more content than before.
Find All the Insights in Our US Brand Report!
We’ve created an in-depth but clear brand report for you that can be downloaded below. In it, you can find data for all 20 brands. While we point out the most interesting results as an overview, you can also find every detailed chart for it in the ebook. If you’ve any questions about the data or would like to know more, feel free to comment on this blog post, send us a message on Facebook, tweet to us or send me an email. I'm looking forward to your feedback and questions!
Tip: Find out how to optimize your social media analysis with five steps we created in collaboration with researches at the University of Zurich.