Do Reels Perform Better Than Other Instagram Post Types?
Report Analyzing 20 Top Profiles by

Table of contents
Brands post more Instagram Reels on average than other Post Types
The highest number of Reels are shared on Fridays
Reels get more likes on average
Reels receive more comments on average
Interaction Rate is decreasing across all Post Types
Hashtags don’t necessarily lead to higher engagement with Reels
Reels get the most interactions at 2:00 pm CESTs
Beauty and fashion brands still prioritize Images - but Reels are catching up
Introduction
Whether you’re considering including Instagram Reels in your social media strategy, or you’ve already started posting them, there’s probably one question on your mind.
Are Reels actually worth the effort?
After all, Reels require more time and creativity than a regular Instagram post. They’re often multi-clip videos edited with audio, text, and effects - and people expect to see interesting, trending content as they browse through new Reels.
Before you start making Reels, you’ll want to know how they perform in terms of engagement and likes.
There’s lots of discussion about how popular Reels are, but we decided to dig into the data to find out exactly how they stack up compared to other types of content you can post on Instagram.
What are Instagram Reels?
Reels are short videos (90 seconds maximum) and, just like TikTok, creators can record, edit and add effects to their videos without leaving the Instagram app. Reels are heavily trend-focused so they can be a great way to reach new audiences beyond your current follower count.
In August 2020 Instagram released Reels hoping to claw back some screen time lost to TikTok. According to a 2022 announcement from Meta, Reels now account for 20% of all activity on Instagram.
Instagram has optimized its user interface for Reels, and the algorithm now aggressively pushes them.
It’s got to the point where, if you aren’t making them, your posts may not appear as often in feeds. In fact, even The New York Times reported that small businesses who haven’t embraced the short video format have noticed a drop in their engagement and reach. (Food Businesses Lose Faith in Instagram After Algorithm Changes, The New York Times, March 23, 2022)
Now that Instagram has made Reels data public, we decided it was the perfect time for an analysis of Reels. These insights come from publicly available data collected with Facelift Data Studio, a social media analytics tool where you can get detailed data insights from all your channels to optimize your brand’s social media performance.
Methodology
To find out how impactful Reels are, we used our social media analytics tool to collect in-depth data from 20 of the most-followed brand accounts on Instagram across a variety of industries - fashion, sportswear, entertainment, cosmetics, sports, automobiles, and more.
These are the 20 profiles we analyzed:
- @natgeo - 232M
- @nike - 228M
- @realmadrid - 121M
- @fcbarcelona - 109M
- @victoriassecret - 73M
- @nba - 68.9M
- @marvel - 65.3M
- @zara - 51.8M
- @chanelofficial - 51.3M
- @hudabeauty - 50.6M
- @gucci - 48.7M
- @louisvuitton - 48.5M
- @dior - 41.2M
- @mercedesbenz - 35.6M
- @bmw - 33.5M
- @lamborghini - 32M
- @netflix - 30.6M
- @prada - 29.9M
- @kyliecosmetics - 25.9M
- @maccosmetics - 24.5M
For most of the analyses, we used the 30-day time period between June 20th and July 19th, 2022. In some cases, we also examined how trends evolved over the past year, from July 2021 to July 2022.
Before we get into the Reels comparison, let’s briefly go over the different types of content you can post on Instagram.
Types of Instagram posts: Carousel vs Image vs Video vs Reels
The four main types of feed content on Instagram: Images, Carousels (a gallery of images), Videos, and Reels.
Carousel vs Image
A Carousel post can contain up to 10 images that viewers can swipe through.
In a 2022 report, scheduling app Later found that Carousels were the post type with the highest engagement rate, however, Instagram had not made Reels data public at the time.
Instagram Reels vs IGTV
IGTV used to be a separate platform but it has now merged with Instagram Video.
While Reels are ideal for short-form, visually exciting content, Videos are better for long-form content.
For example, a fashion brand might make use of Instagram Video to produce an in-depth style tutorial, then create a Reel featuring a snappy montage of trending outfits, set to music.
How do Instagram Reels perform compared to other post types?
Now let’s get into the data to analyze how Instagram reels perform compared to other post types.
1. Brands post more Instagram Reels on average than other Post Types
Brands are clearly putting their faith in Instagram Reels, as our data shows that, on average, they post more reels than other types of content.
Looking at the Posts per Post Type metric below, we can see that on average, Reels are the most popular type of post.
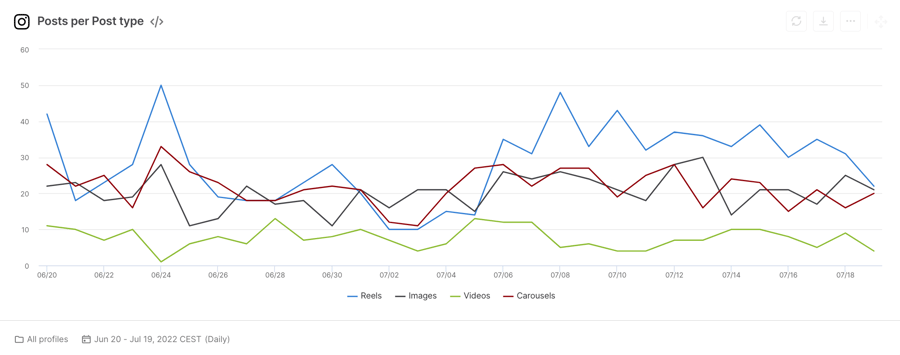
Post per Post type
The Post Type Distribution Per Profile metric shows us that for many brands, Reels are the majority of their posts. For example, Reels make up 60% of Netflix’s posts, and 76% for Huda Beauty.
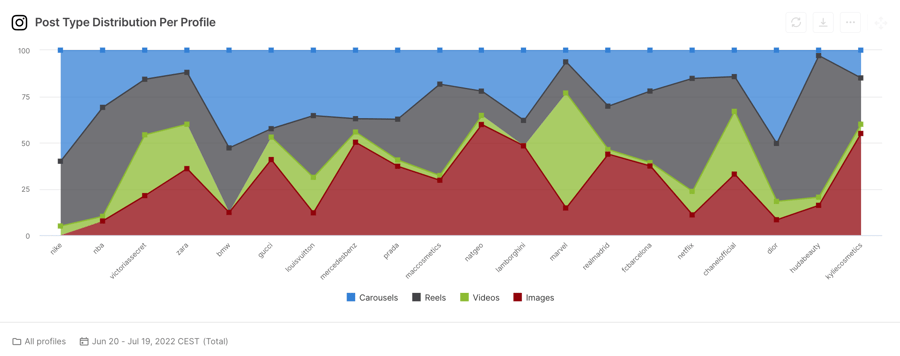
Post Type Distribution Per Profile
Overall, Reels are the most commonly used post type, followed by Carousels, Images, and Videos.
If we go to the Key Metrics Table, we see that the NBA shared the most posts during this 30-day period. Out of a total of 518 posts, 305 of them were Reels - more than half.

Key Metrics Table
How has that changed over time? Well, by looking at Posts per Post type from July 2021 - July 2022, we can see that Carousels were in the lead for most of the year until Reels suddenly took over in June 2022.
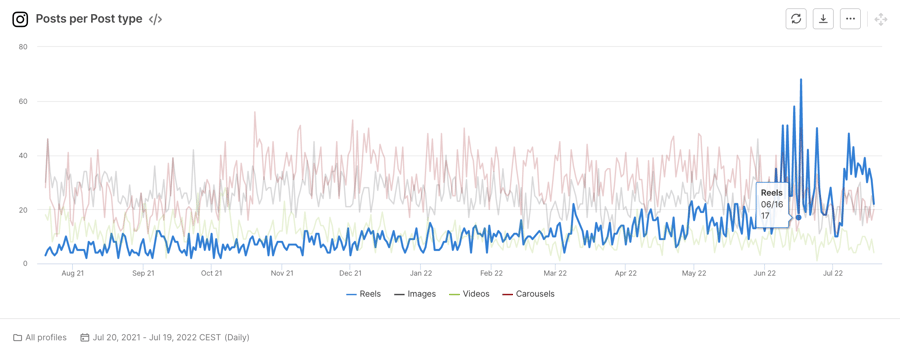
Post per Post type
2. The highest number of Reels are shared on Fridays
In the Post by Weekday Per Post Type graph, we can see that the most popular day for sharing Reels was Friday, and Monday was the second most popular. Monday was also the most popular day to share images.

Posts By Weekday Per Post Type
Surprisingly, Saturday and Sunday were the least popular days for sharing reels.
If you’re wondering when to post a Reel, why not try Saturday? Less competition might mean you have more chance of standing out.
3. Reels get more likes on average
According to our Likes by Post Type metric, Reels get a higher percentage of likes compared to other posts.
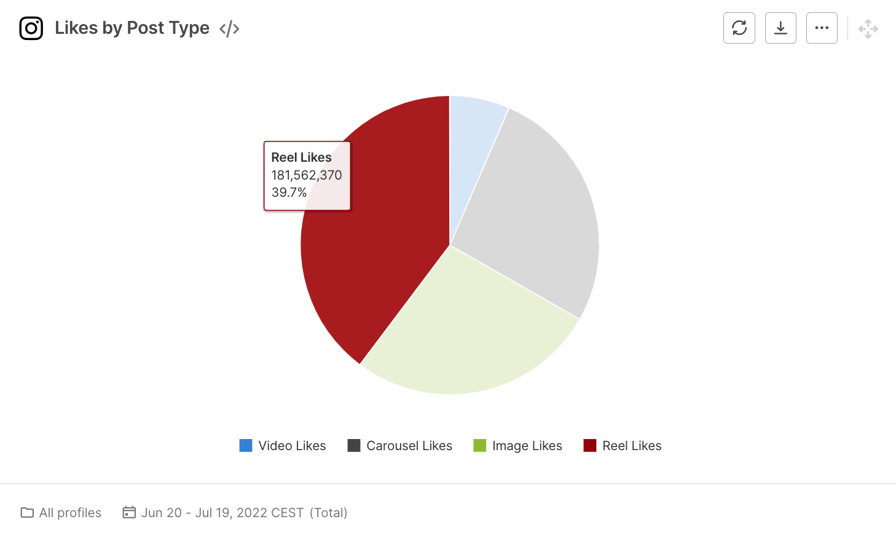
Likes by Post Type
Reels got 39.7% of the total amount of likes for all the profiles during the time frame. Images and Carousels both got around 27% of likes each.
Videos got the lowest percentage of likes, at just 6.5%.
4. Reels receive more comments on average
The results for likes were also mirrored when we looked at the percentage of comments each post type gets on average.
Reels got 36.7% of all comments, and again videos got the lowest percentage of comments, at 9.5%.
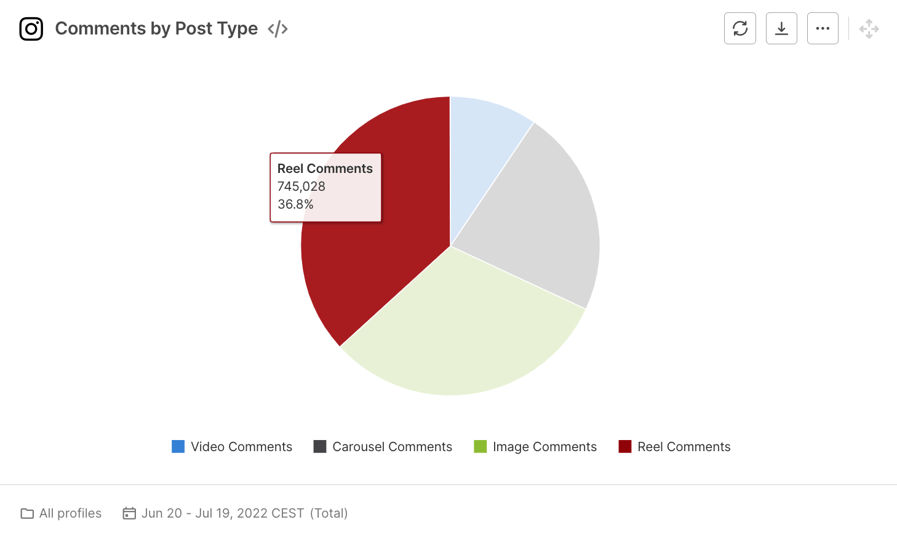
Comments by Post Type
Perhaps Reels get more likes and comments because people find them more interesting, funny, and engaging than other types of content.
Alternatively, it could be that more people see Reels because of Instagram’s decision to prioritize them over other types of content.
Either way, if you’re looking to get more likes and comments on your posts, creating more Reels might be the way to go. That being said…
5. Interaction Rate is decreasing across all Post Types
Lately, the Instagram algorithm has been the subject of much criticism because it seems to favor video content over photos. The message “Make Instagram Instagram Again” has gone viral, with influencers like Kylie Jenner and Kim Kardashian reposting it and demanding that Instagram “stop trying to be TikTok”.
This even prompted a response from Instagram CEO Adam Mosseri who said that the new video-friendly full-screen experience that Instagram is testing among a small pool of users is “not yet good”.
However, it’s not just photos that are losing out on engagement. The data shows that Interaction Rate on Instagram is declining across the board, regardless of Post Type.
In the 30-day period between June 20th - July 19th, 2022, The Interaction Rate of Images posted by the 20 brands we analyzed dropped by nearly 38%. Even Reels suffered a significant loss, dropping by nearly 28%.
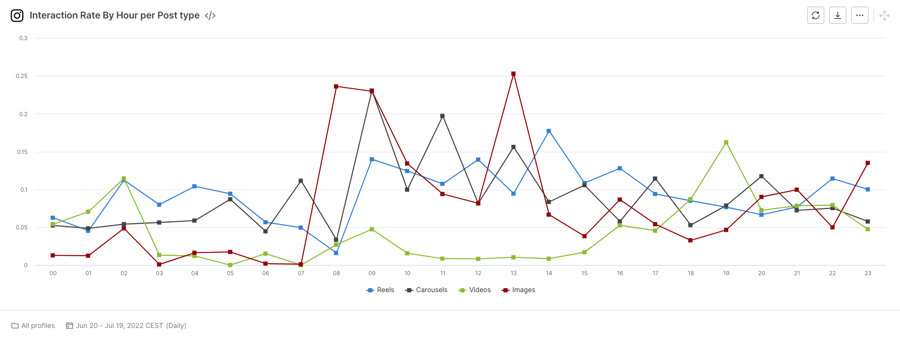
Interaction Rate Counts for each Post Type, June 20th - July 19th, 2022
If we look back on the past year, we can observe a similar downward trend in Interaction Rate across all Post Types. In fact, since July 2021, the Interaction Rate of Reels has dropped the most, by almost 40%, even though this is the content format Instagram seems to be pushing the most.

Interaction Rate Counts for each Post Type, July 2021 - July 2022
We have yet to see how these changes will affect brands’ Instagram performance in the long run. In the meantime, you may want to consider expanding your social media strategy to other platforms that boast higher Interaction Rates such as TikTok
6. Hashtags don’t necessarily lead to higher engagement with Reels
It’s common knowledge that hashtags help you get more interactions on your posts - right?
Not necessarily. Looking at Interaction Rate by Number of Hashtags over the year, we can see that more hashtags don’t particularly correlate with more interactions.
In fact, Netflix used an average of 0.04 hashtags per post - practically none - yet they saw a fairly high engagement rate of 0.88% on their posts.
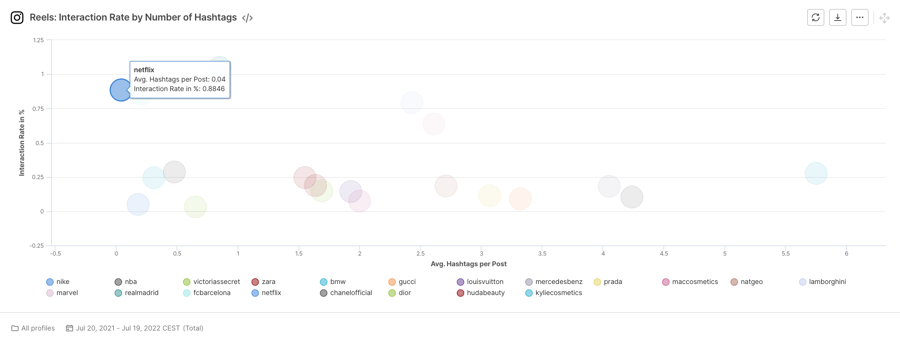
Reels Interaction Rate by Number of Hashtags
On the other hand, BMW used 5.75 hashtags per post and had a much lower engagement rate of 0.27%.
These results weren’t unique to Reels though. Across all post types, more hashtags didn’t result in higher engagement.
Perhaps this reflects that Instagram users are tired of seeing too many hashtags in posts, and creators now avoid adding hashtags to the post itself, instead opting to include them in the comments.
7. Reels get the most interactions at 2:00 pm CEST
When looking at the 30-day timeframe, 2:00 pm CEST (7:00 am CT) seems to be the sweet spot for interactions on Reels.
Though the peak varies for each post type, most Instagram posts receive more interactions in the middle of the day, with Images hitting their peak at 1:00 pm CEST (6:00 am CT).
Interaction rates tend to be lower from midnight to 7:00 am CEST (5:00 pm to 12:00 am CT).

Interaction Rate By Hour power Post type
When you decide what time to post Reels, you’ll have to factor in your location and more importantly, where most of your audience is.
8. Beauty and fashion brands still prioritize Images - but Reels are catching up
We thought it would be interesting to filter our data set by industry.
When looking at all the brands that fall into the category of beauty and fashion we noticed that these brands still post more single images than any other kind of post.
Clearly, beauty and fashion brands (traditionally the brands that have the most success on image-driven platforms like Instagram) still benefit from single-image posts.
However, there are signs that this could be changing. Among beauty and fashion brands, Reels were the second most popular content type, making up 25% of posts, and most of their comments were on Reels (41.5%).
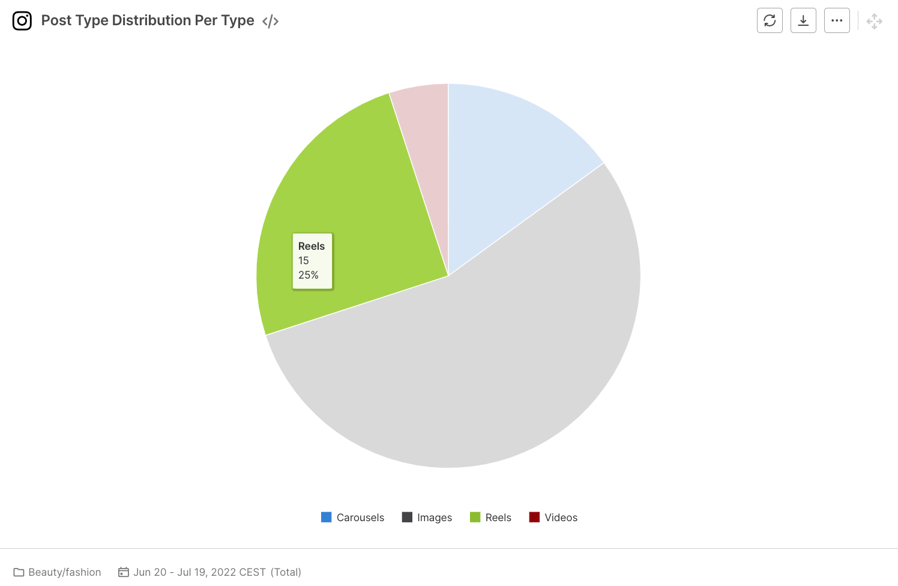
Post Type Distribution Per Type
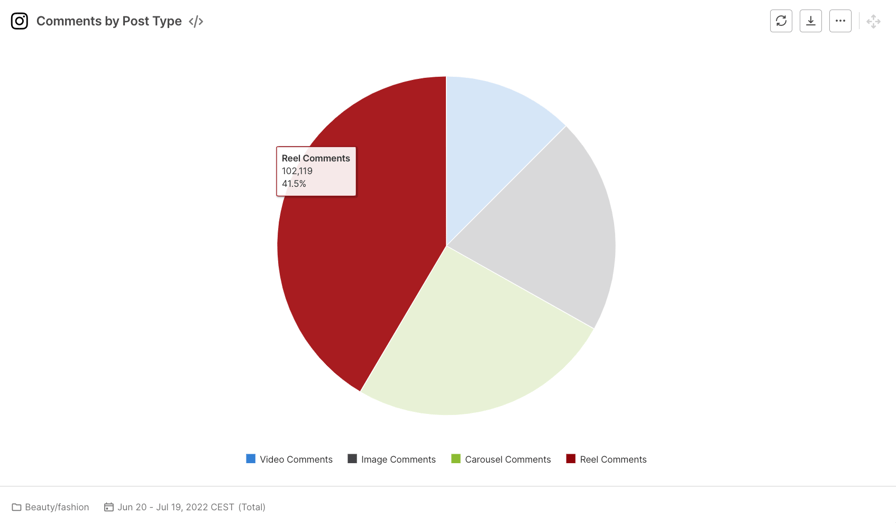
Comments by Post Type
9. Cars brands are slower to adopt Reels
We included 3 car brands in our research - Mercedes Benz, Lamborghini, and BMW.
In contrast with the other industries, car manufacturers post fewer Reels than any other type of content, and they make up just 10.3% of all post types.
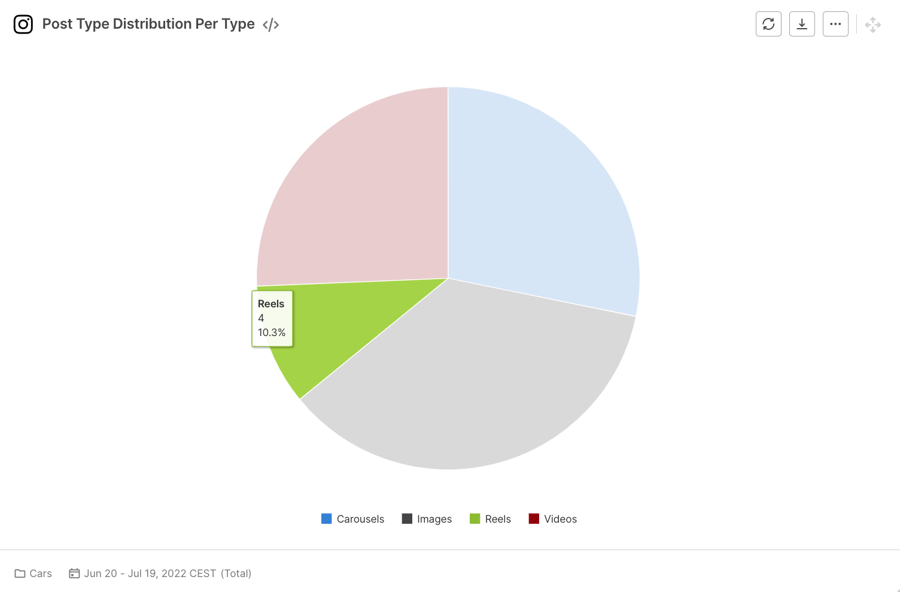
Post Type Distribution
However, these car brands still saw a fairly high amount of interaction on the Reels they did post. Could this be a sign that even more traditional industries can benefit from exploring new content formats? At the very least, there’s nothing to lose.
Instagram Reels are on the rise
Looking back at our research, it’s clear that Reels are on the rise.
Brands are making them, people are watching them, and Instagram is prioritizing them, apparently at the expense of other content formats.
At the beginning of the article, we asked whether Reels are worth the effort. But maybe a better question would be - can brands afford not to get on the Reels bandwagon if they want to maintain - or boost - their presence on Instagram?
Though Reels require more creativity than the average Instagram image post, it seems that, at the moment, the extra effort will pay off.Want in-depth data insights to guide your social media strategy?
You can track all your Instagram analytics, plus data from all your social media channels, with Facelift Data Studio.


