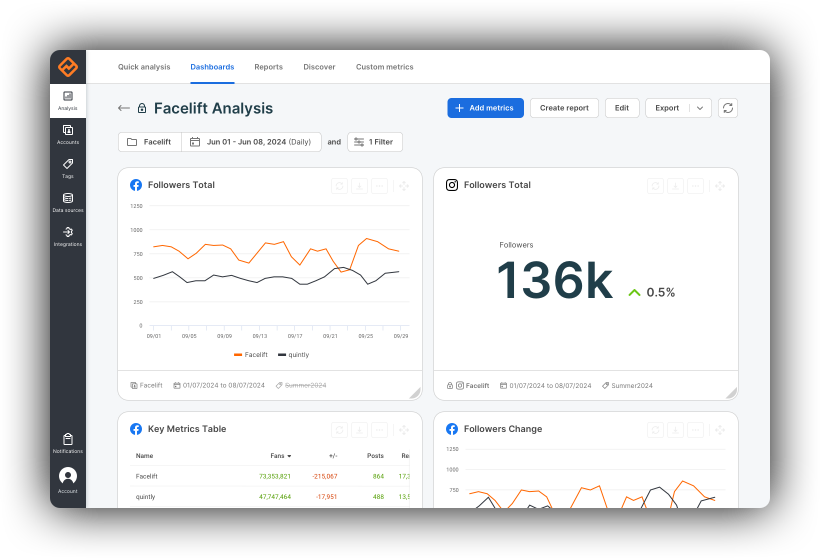
Brand new analytics for Snapchat to take your social strategy to the next level.
Gain deep insights into the performance of your owned Snapchat Story Studio content, right down to which Shows, Stories and Snaps make the most impact. Compare content and understand audiences to optimize your strategy.
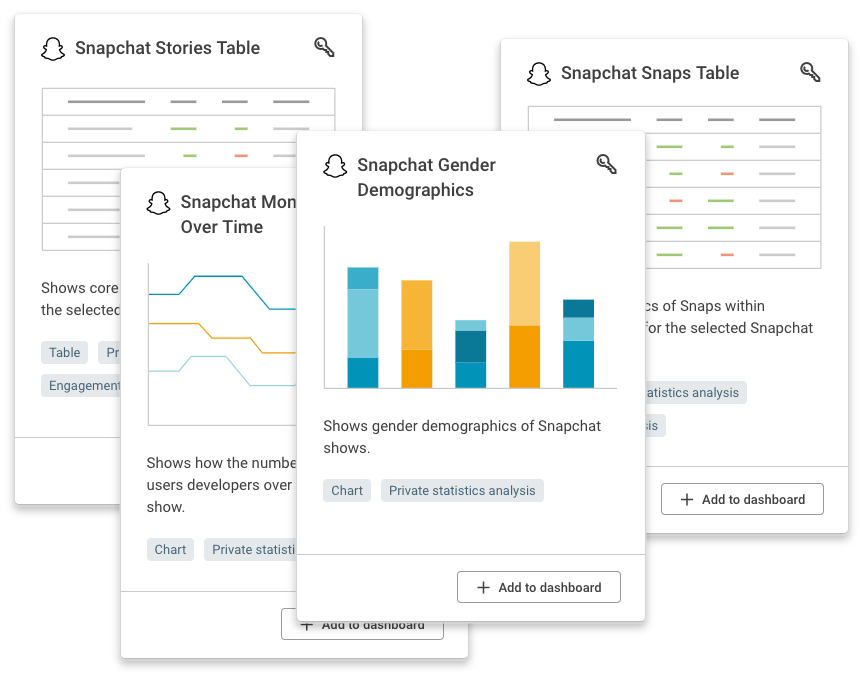
More than 18 new metrics allow you to track and compare your content
With Facelift Data Studio, you simply and securely connect to your owned Snapchat Story Studio account to add which metrics you want and get to work analyzing. With metrics covering all sides of content, right down to Show level, Stories level and Snaps level KPIs.
Shows metrics
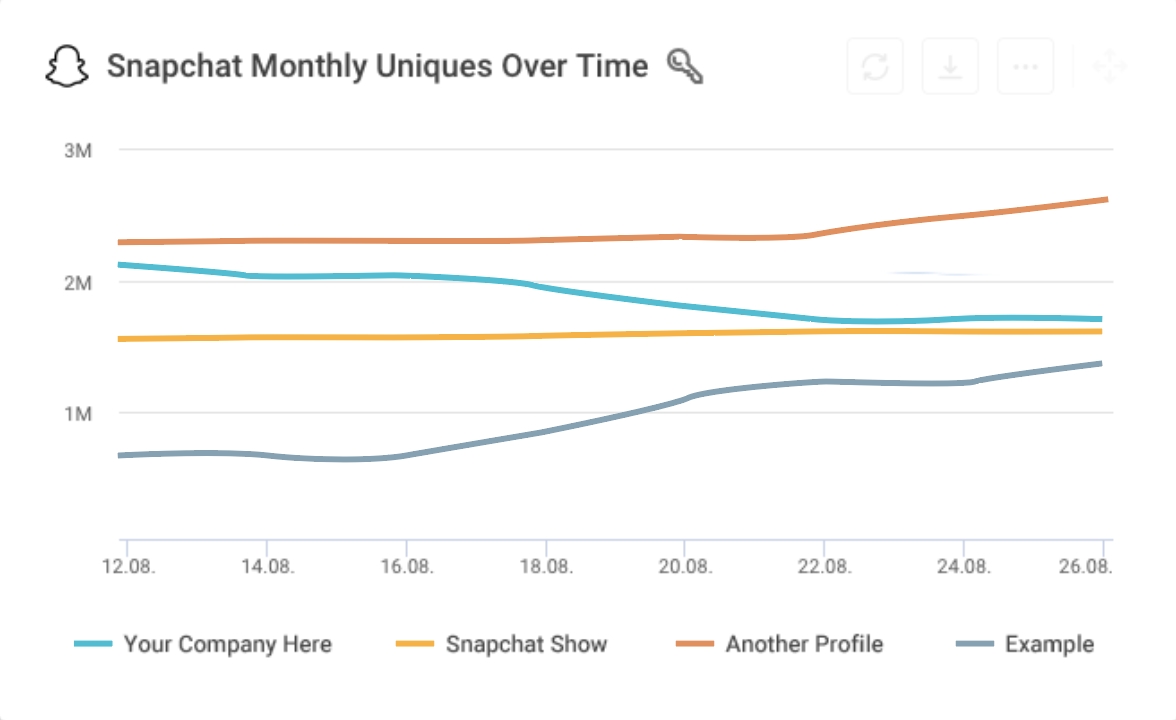
Track the loyalty of your viewers, get more information on demographics, the development of monthly unique users per Show and much more!
Stories metrics
Analyze every story – also within your Shows. Get insights on total views, unique viewers, the completion rate of your story and more.
Snaps metrics
Compare your published Snaps to each other and find out which one got the highest reach or completion rate. We provide demographics, shares, total views and many more metrics.
Take advantage of the Snapchat data you didn’t even know you had
Get in touch with important data points and track key metrics for Top Episodes and Stories as well as the Snaps within Stories like Completion and Drop-off rates, Reach, Shares and much more.
For businesses on Snapchat, understanding your audience is everything
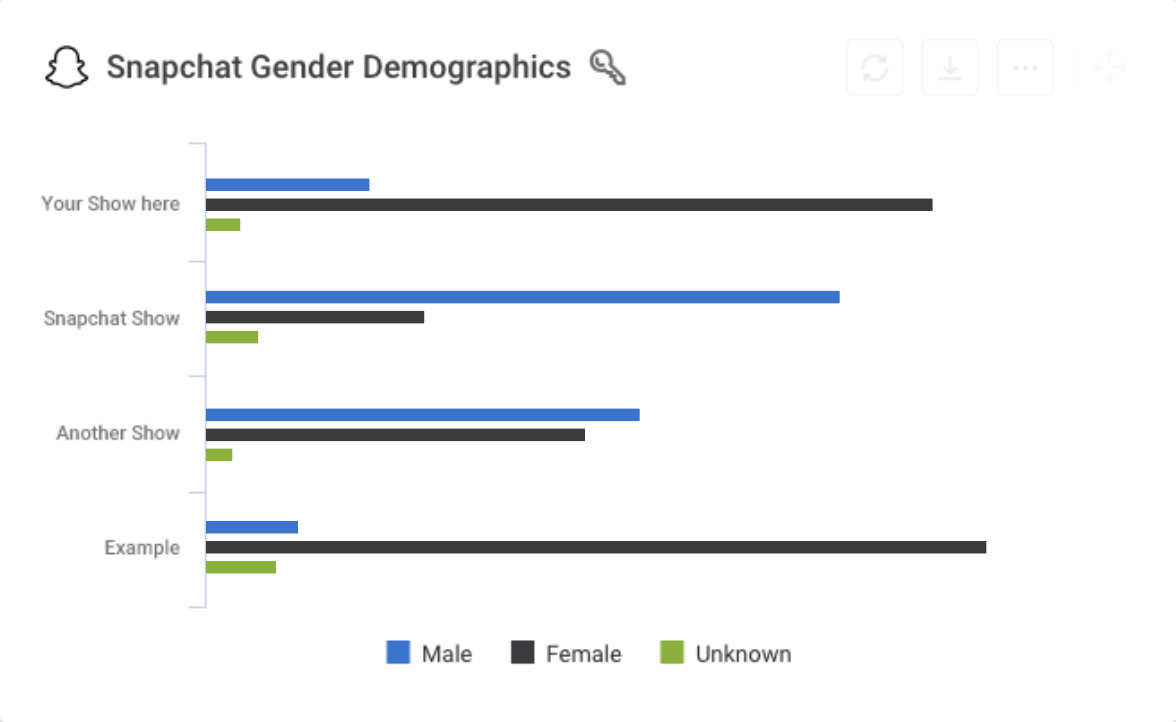
At every level of Facelift Data Studio’s Snapchat Story Studio analytics, metrics give you instant insights into audience demographics like age distribution, gender and the relative frequency of them browsing your Shows and Snapchat content.
“Facelfit Data Studio is probably my favorite social media analytics service on the web. It helps me track, benchmark, and optimize my social performance with accurate analytics.”
With Facelift Data Studio, it's advanced analytics for Snapchat Shows made simple
Metrics in Facelift Data Studio are designed to be detailed yet easy to work with, delivering key metrics and KPIs in a friendly interface with customization options to help you make your dashboards look great and work even better for reports ready to set up in seconds.
"We use quintly to track social media performance across 100+ social channels and compare global goals across networks in 36 markets. quintly's data insights helped us achieve over 22% growth in year over year reach and 50% in total engagement."
"quintly has become a vital tool for our marketing department for both looking back at our social media performance, but also helping us build a better more educated strategy moving forwards."
"quintly is the best tool for social media channel analysis we've tried so far - and we've tried a lot of tools. It's easy to use, with a wide variety of features and optional custom designed additions, making it optimal for quick overviews as well as in depth analysis."
"quintly is probably my favorite social media analytics service on the web today. It helps me track, benchmark, and optimize my social performance with super-smooth analytics."
"The tool is very flexible and allow us to create our own KPIs, reports and dataset for API exports. The communication between the devs and the customers is very professional. We feel that there are humans behind the machine."


