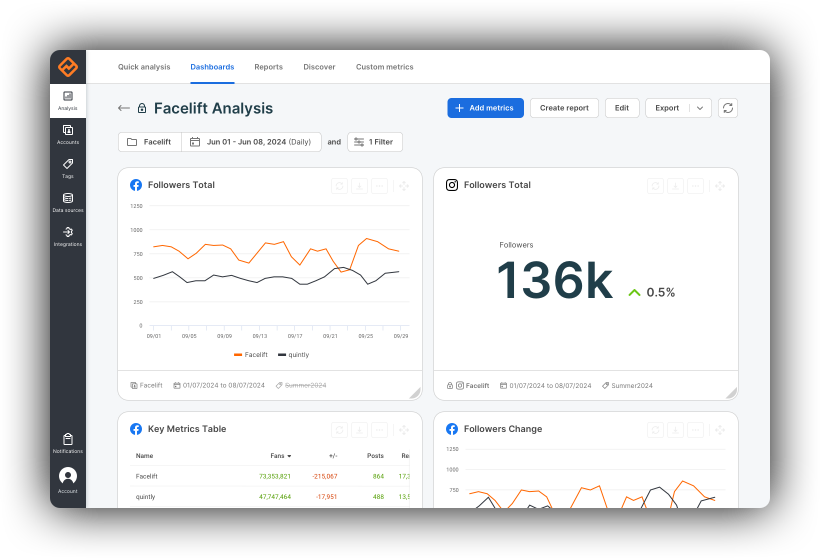
Create real impact with Instagram Analytics
Make sense of your Instagram marketing effectiveness by tracking all public and Insights data. Leverage your competitive advantage with social media benchmarking and optimize your strategy based on easy to create automated reports.
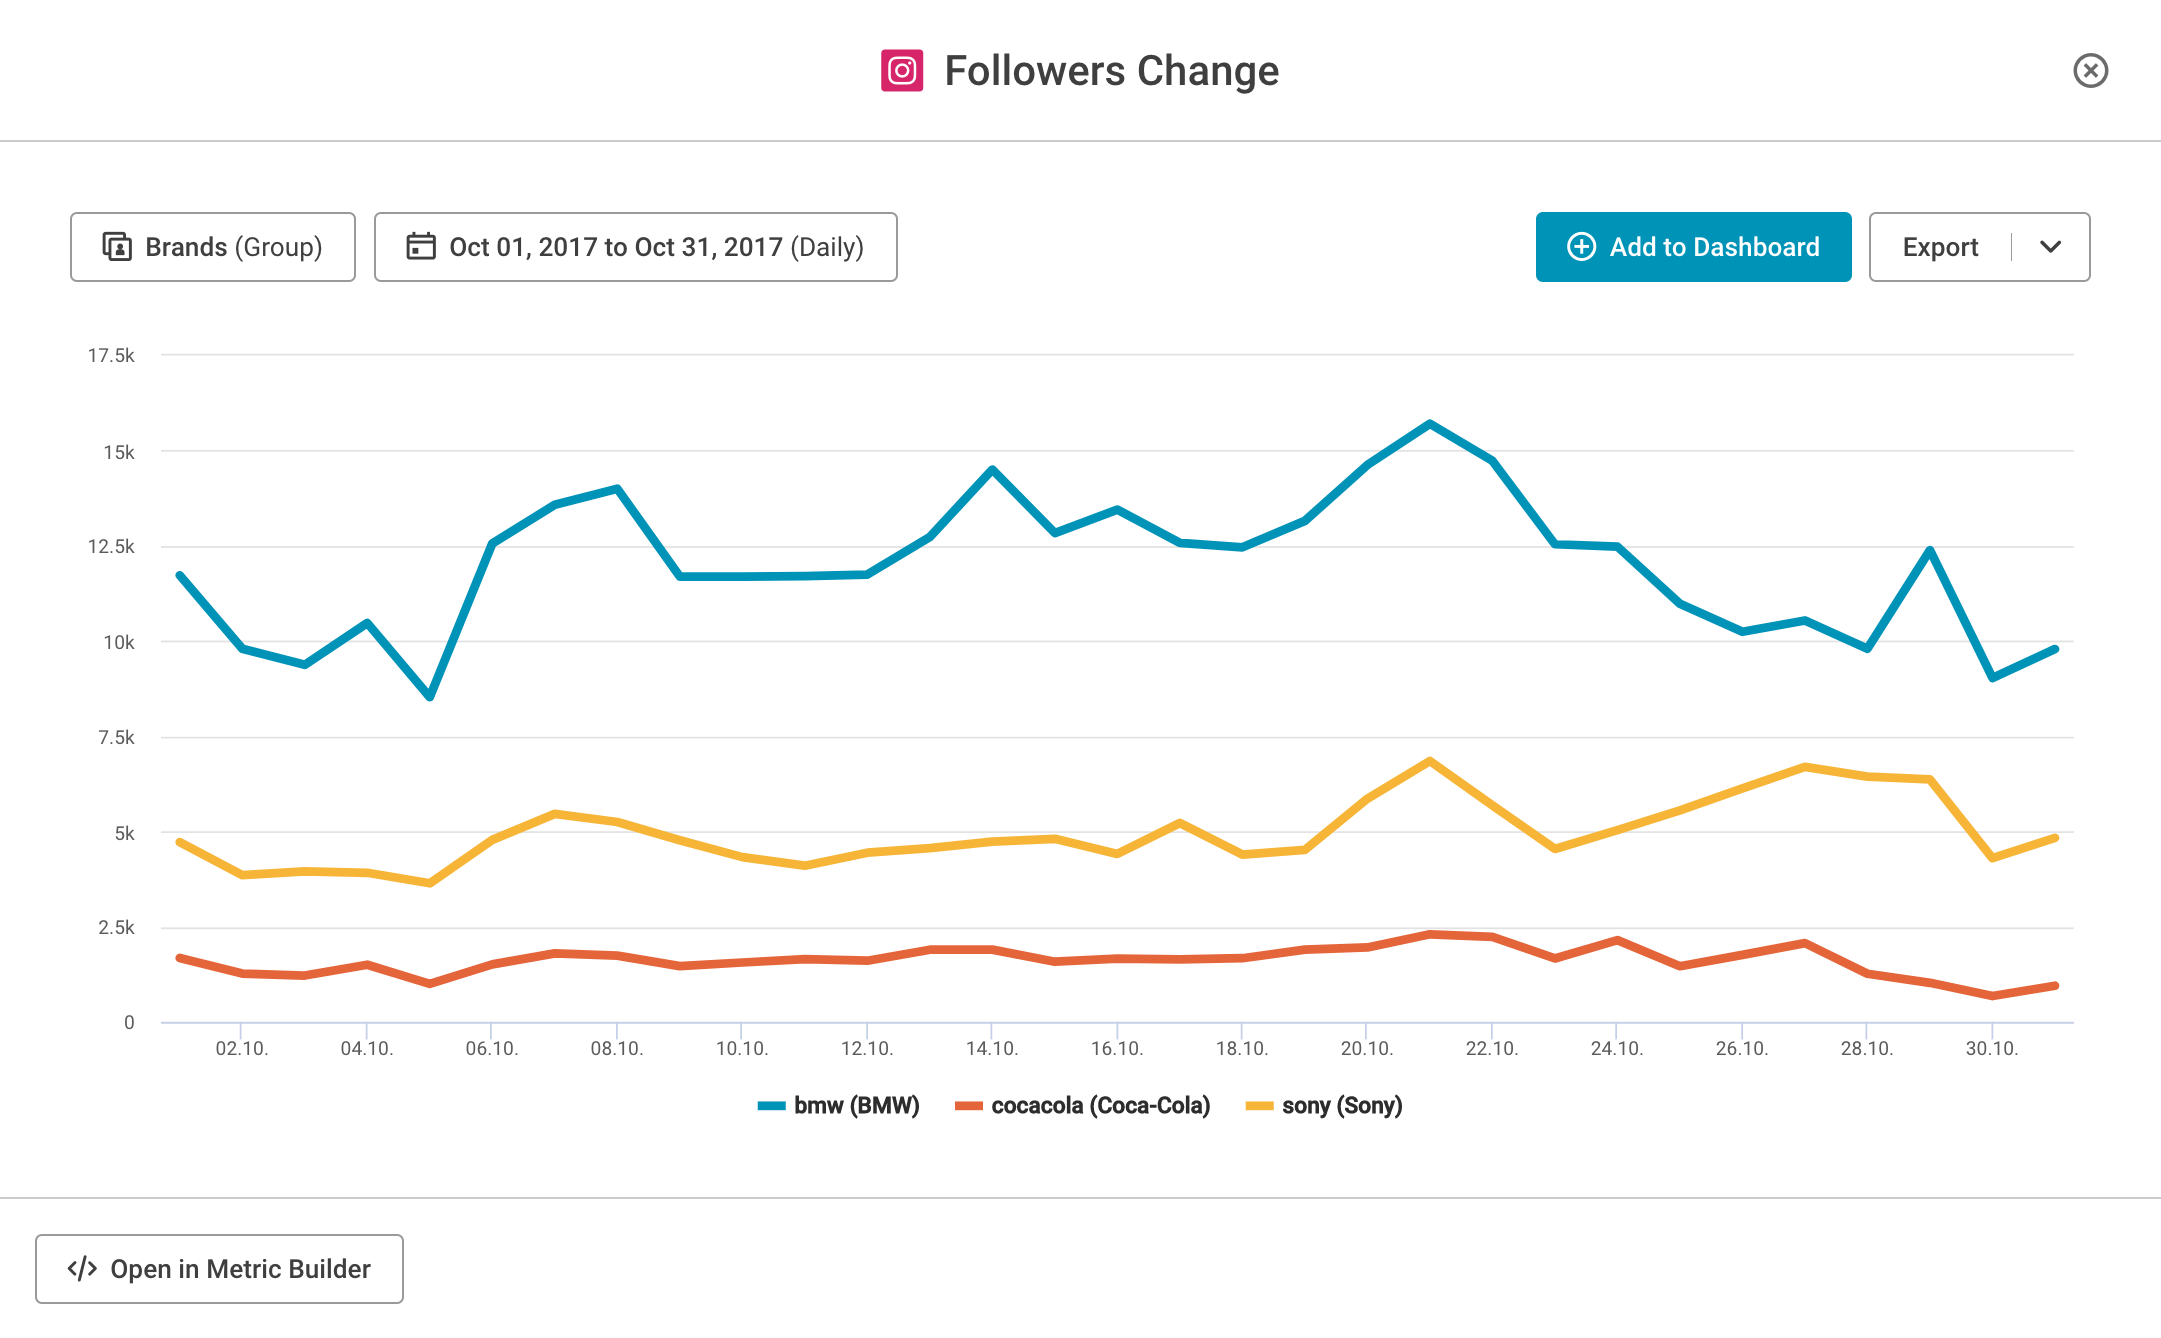
Track and analyze all the Instagram KPIs that matter to your business
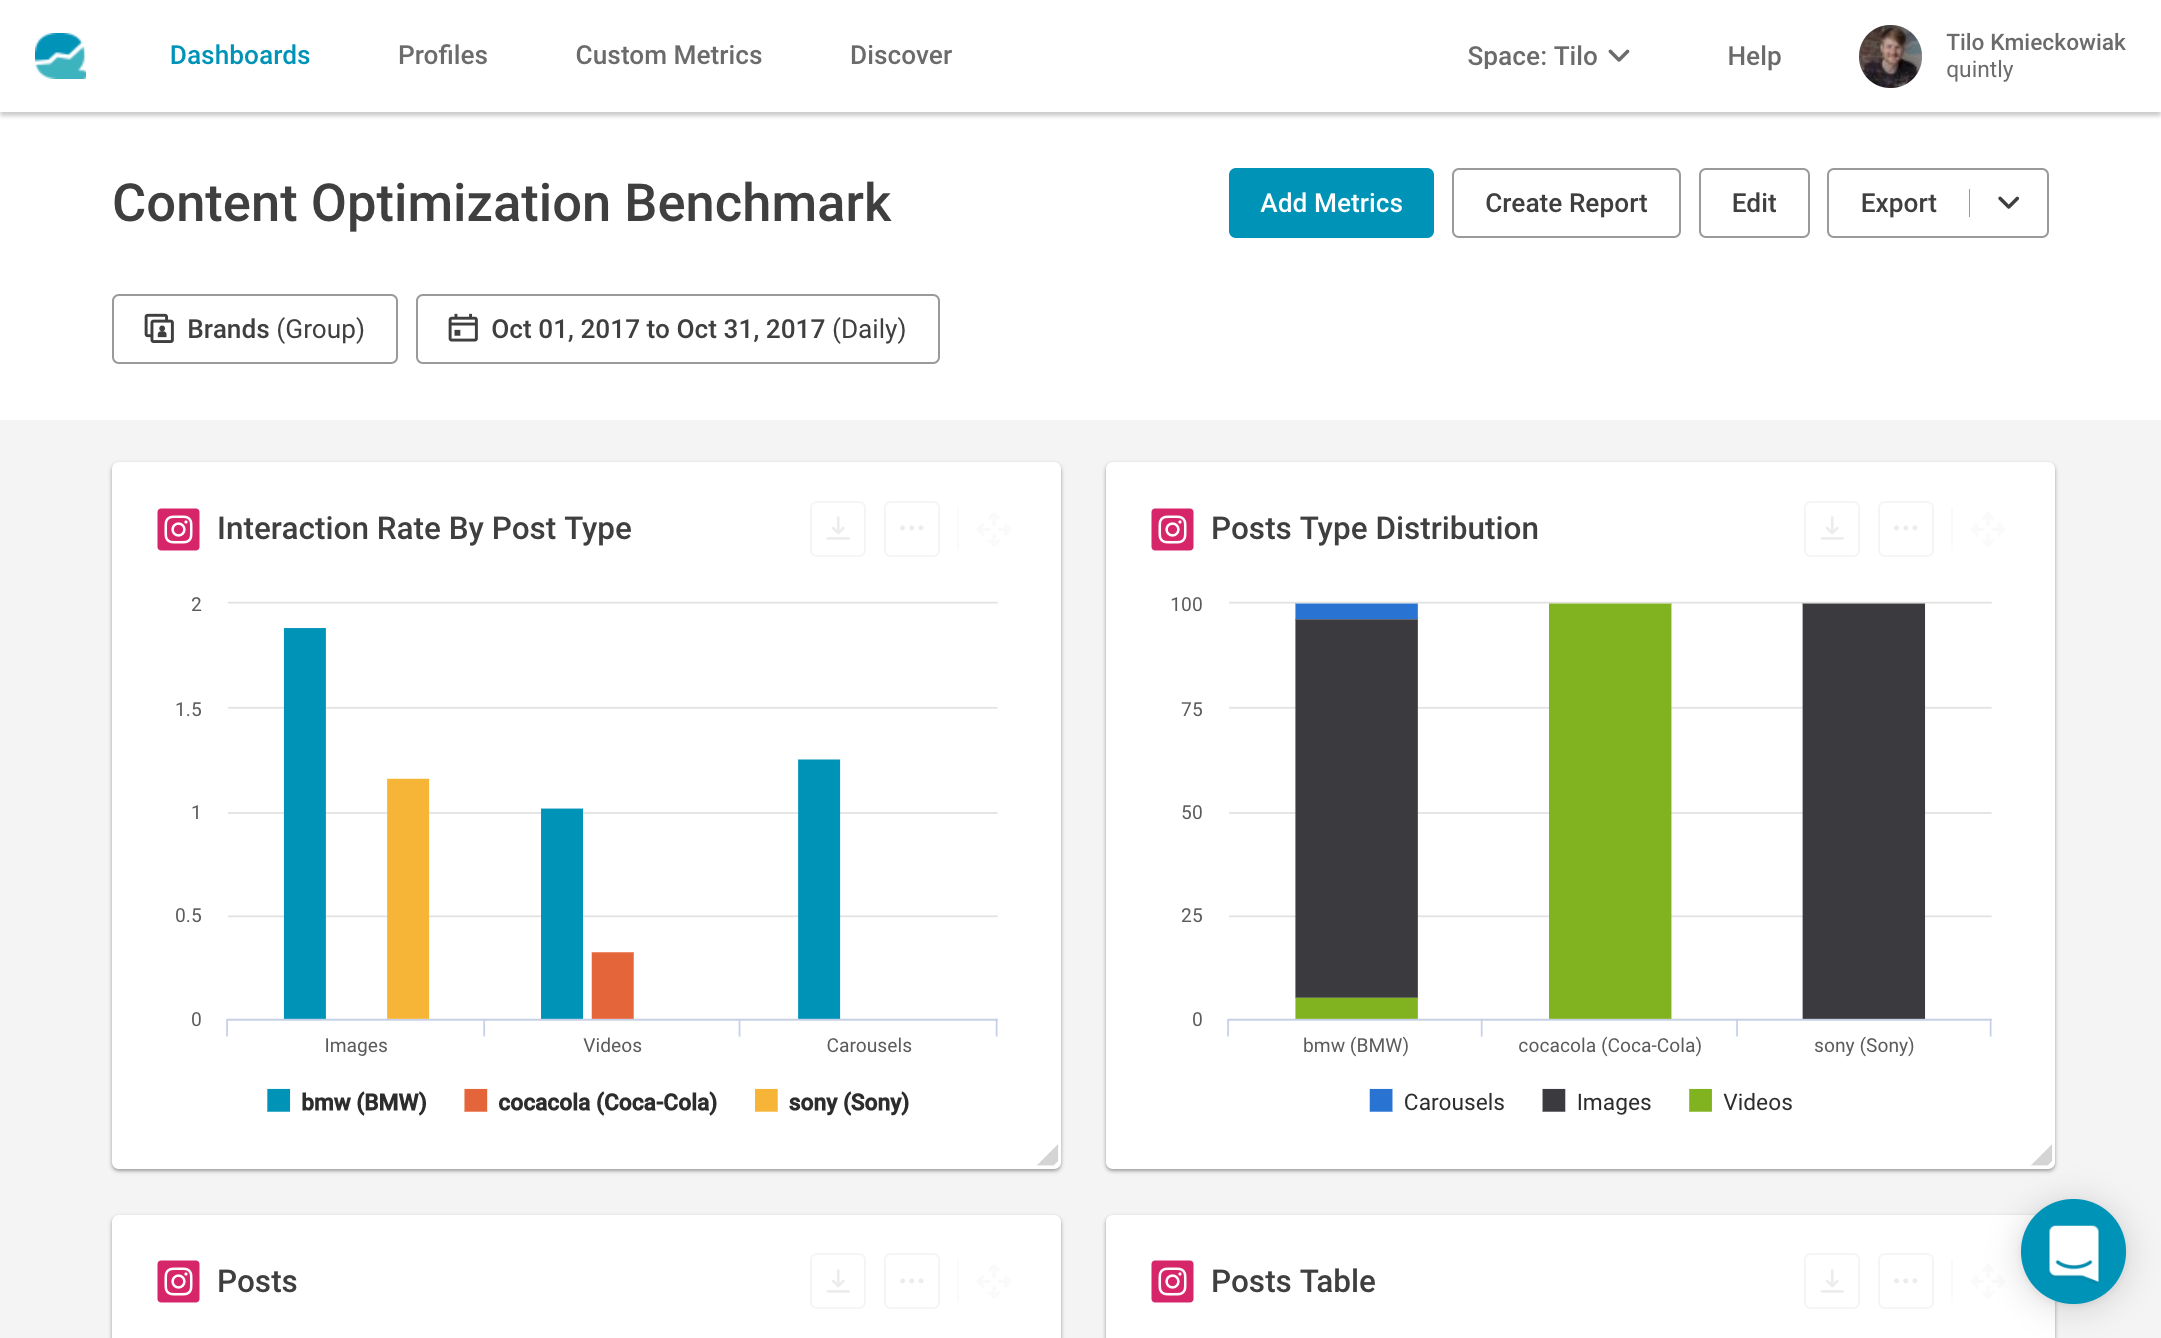
Display your relevant data by choosing from a wide pool of metrics – no matter if it’s for followers, posts or engagement. Easily browse through of them in our handy metric library. Customize and arrange metrics on flexible dashboards that exactly fit your specific social media goals.
Followers
Analyze how many new followers you gain. Also get in-depth insights into when you grow your follower base.
Content
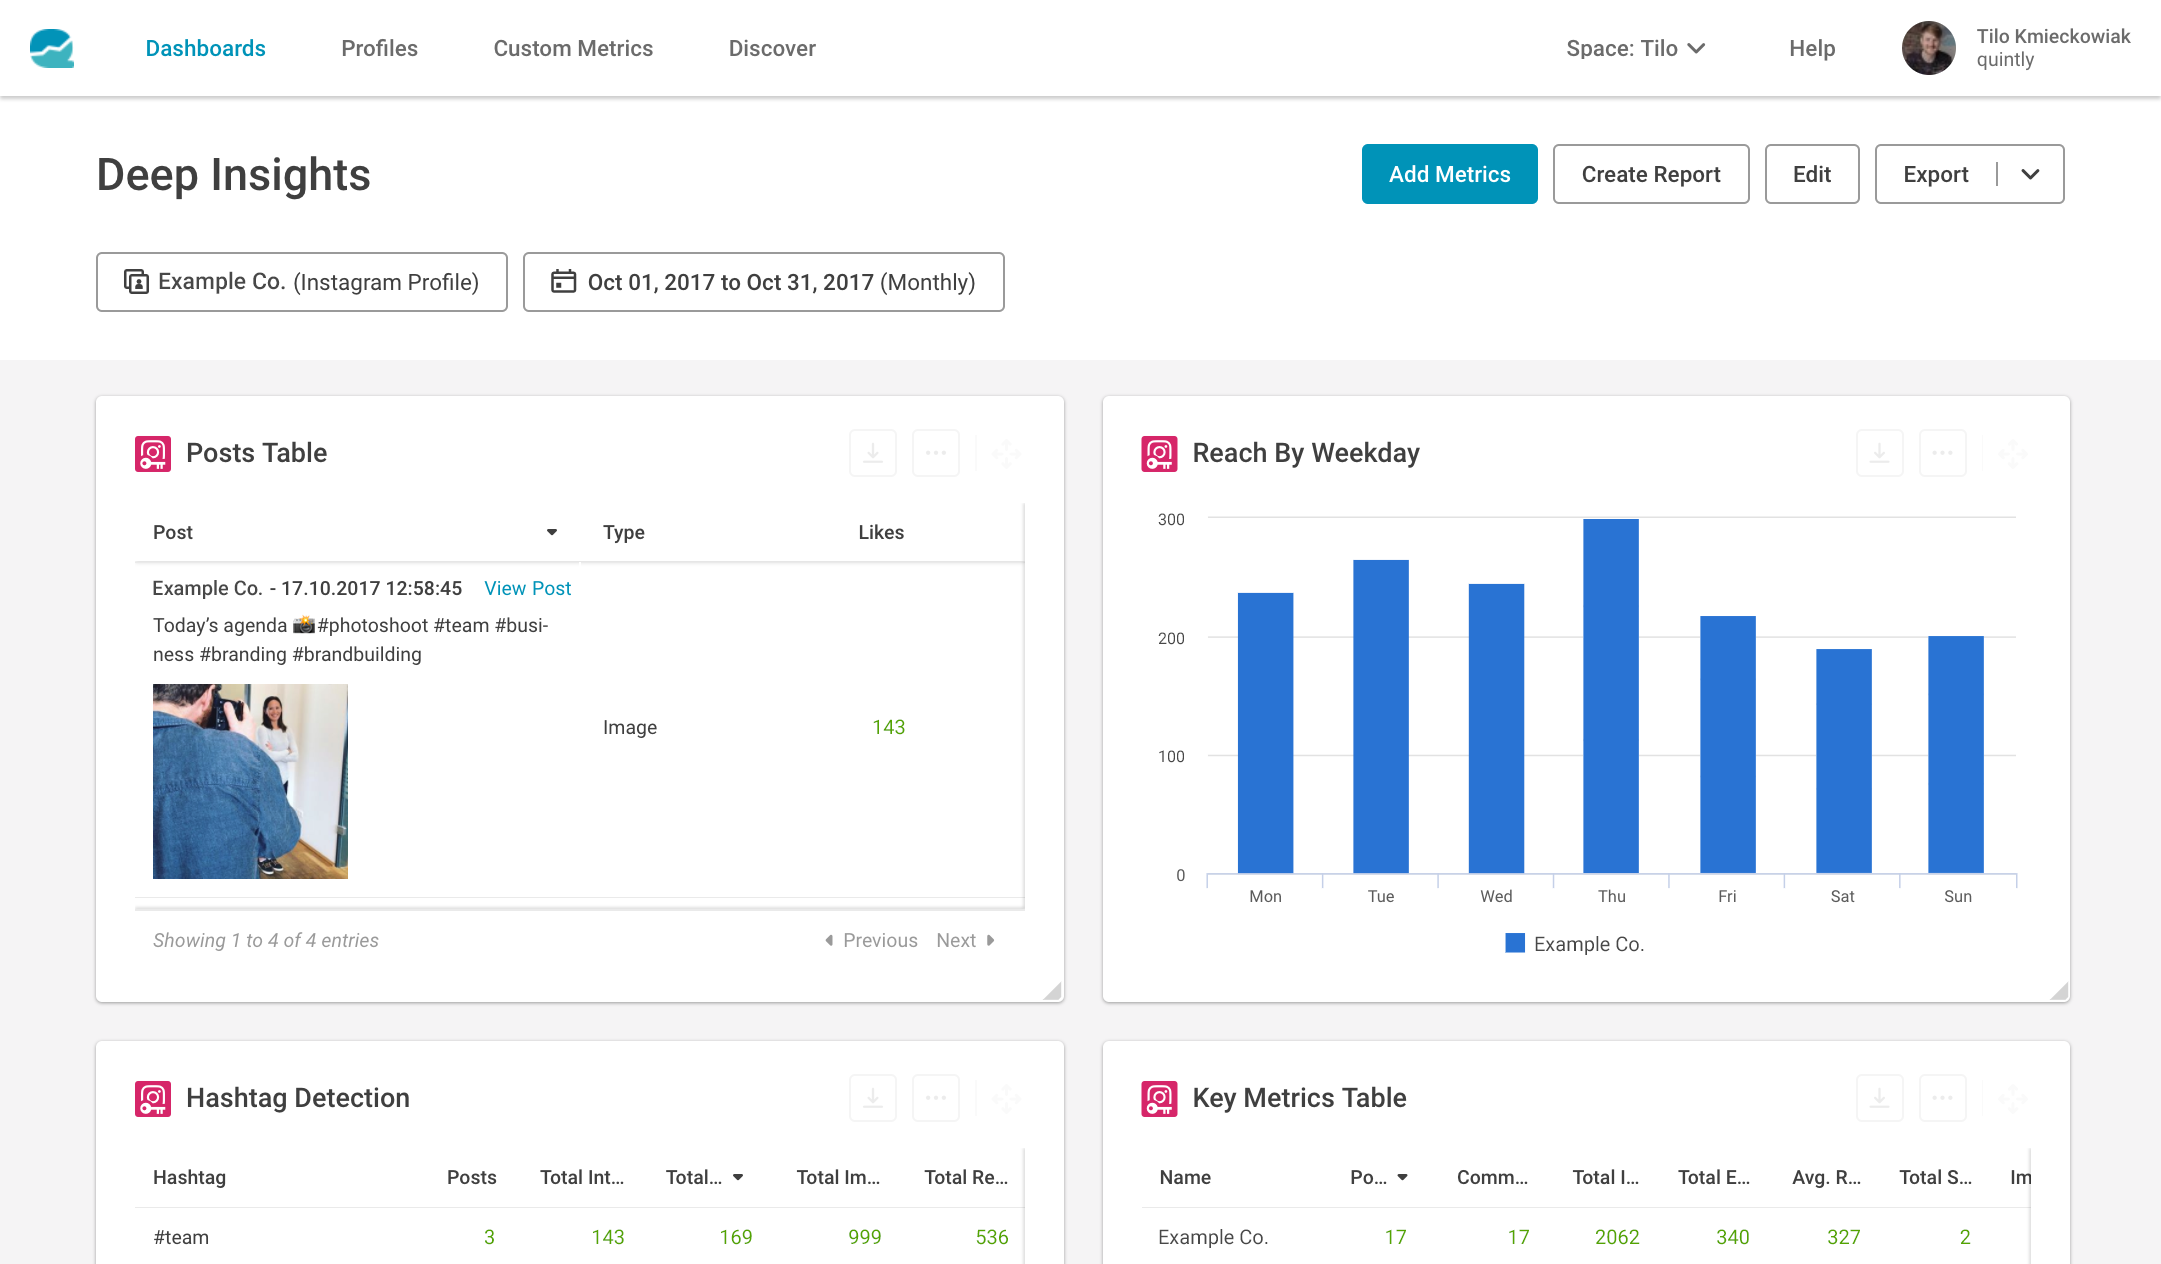
Closely monitor how often and when you post. Keep an eye on the different content types you publish and which hashtags work best.
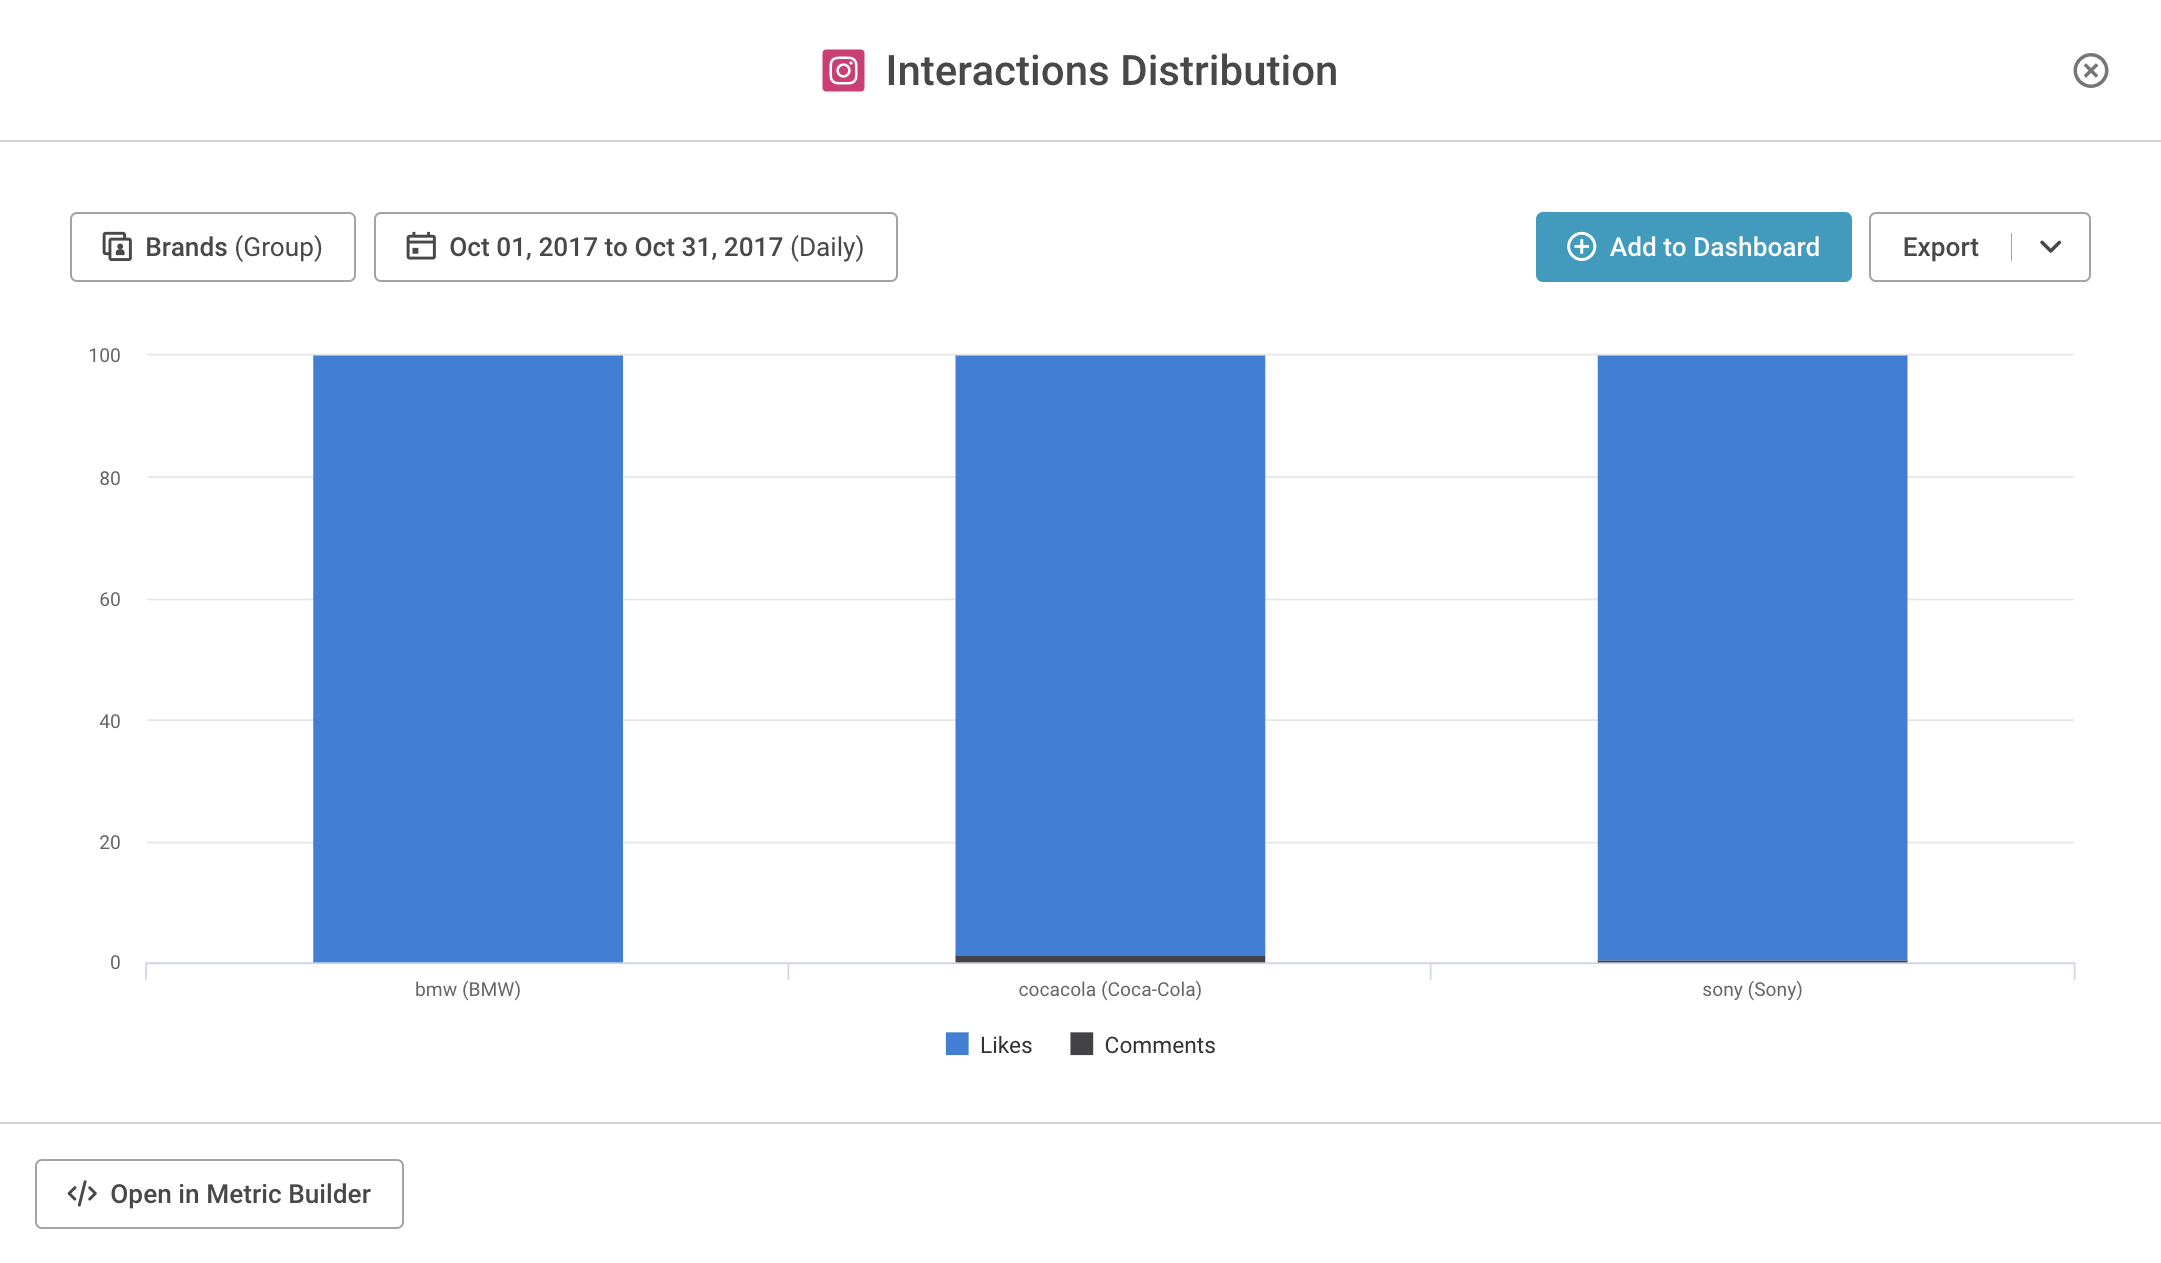
Interactions
Measure what resonates on your followers’ timelines. Find out if your audience likes your posts and how much they comment.
Dive deep into Instagram Insights
Find out how many people are reached by your content and how often they see it by accessing Instagram Insights. Display and analyze deep Instagram Insights data to make more sense of your social marketing performance through Instagram analytics.
Get your story straight — analyze your Instagram Stories in Facelift Data Studio
Get the most out of Instagram stories by analyzing all data of your Instagram stories such as Impressions, Reach and Exits. Facelift Data Studio also supports data for expired Instagram stories after you authenticate your Business profile for Insights access. This gives you more options for long-term analyses.
“Facelift Data Studio is probably my favorite social media analytics service on the web. It helps me track, benchmark, and optimize my social performance with accurate analytics.”
Report, export and share findings – fast and easy
Convert your analysis into recurring, automated reports that get sent out to your recipients in any set timeframe. Also export data with a few clicks in various widely used formats like CSV, XLS, JPG and PDF. Share your dashboards as dynamic web pages for your colleagues or clients to explore.
"We use quintly to track social media performance across 100+ social channels and compare global goals across networks in 36 markets. quintly's data insights helped us achieve over 22% growth in year over year reach and 50% in total engagement."
"quintly has become a vital tool for our marketing department for both looking back at our social media performance, but also helping us build a better more educated strategy moving forwards."
"quintly is the best tool for social media channel analysis we've tried so far - and we've tried a lot of tools. It's easy to use, with a wide variety of features and optional custom designed additions, making it optimal for quick overviews as well as in depth analysis."
"quintly is probably my favorite social media analytics service on the web today. It helps me track, benchmark, and optimize my social performance with super-smooth analytics."
"The tool is very flexible and allow us to create our own KPIs, reports and dataset for API exports. The communication between the devs and the customers is very professional. We feel that there are humans behind the machine."


